

On this page
Hang a thin wire over a block of ice, tie a heavy weight to each end and wait. The wire sinks through and drops out of the bottom, yet the block stays in one piece. This is regelation, and it hides a famous misconception.
What is regelation?
Regelation is ice melting under pressure and refreezing once the pressure is removed. As chemist Robert Rosenberg recounts in Physics Today, James Thomson worked out in 1850 how pressure lowers the freezing point, and Michael Faraday lectured on his regelation experiments at the Royal Institution on 7 June 1850.
In the wire demo, three things happen in a loop:
Under the wire the pressure is high, so the ice melts slightly below 0 °C.
The meltwater flows round to the wire's top side, where pressure is normal, and freezes again.
Freezing releases latent heat, which must travel down through the wire and water film to melt the ice below.
Step 3 is why the wire's material matters. When L. D. Drake and R. L. Shreve measured wires moving through ice, copper and nylon wires behaved differently, and air bubbles in the ice slowed every wire (Proceedings of the Royal Society A, 1973). So the demo works better in clear ice than in cloudy ice full of trapped air.
Why does pressure lower the melting point of ice?
Unlike most solids, ice is less dense than its liquid. Liquid water takes up about 10% less volume per mole than ice, so by Le Chatelier's principle, extra pressure pushes ice towards melting (Rosenberg, Physics Today). It is the same oddity behind the anomalous expansion of water.
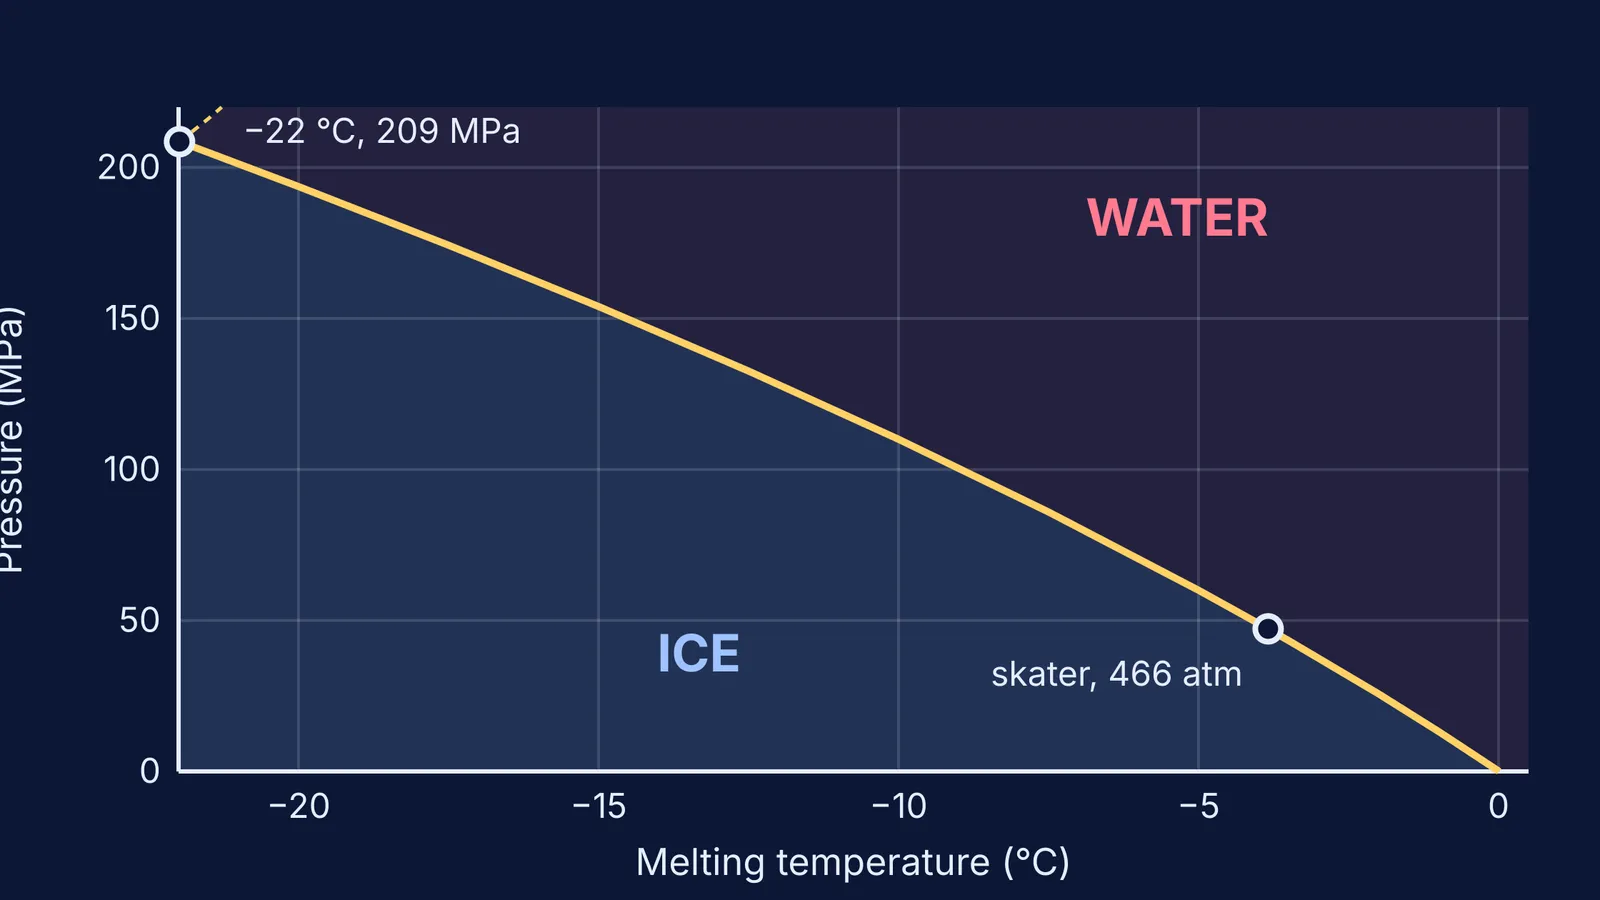
The effect is small. The melting curve for ordinary ice published by the International Association for the Properties of Water and Steam has a slope of about 13.5 MPa per kelvin, roughly 0.0075 °C of lowering per atmosphere (IAPWS R14-08(2011)). A 1 °C drop takes about 13 MPa, some 130 times normal air pressure.
There is also a hard limit: the melting curve of ordinary ice ends at −21.985 °C and 208.566 MPa, where a denser form, ice III, takes over (IAPWS). Below about −22 °C, no amount of pressure turns ice into bulk liquid water.
How much does a loaded wire lower the melting point?
Say two 5 kg masses hang from a 0.5 mm wire across a block 5 cm wide.
Force: 2 × 5 kg × 9.8 m/s² = 98 N.
Contact area (wire diameter × block width): 0.5 mm × 50 mm = 25 mm², or 2.5 × 10⁻⁵ m².
Pressure: 98 N ÷ (2.5 × 10⁻⁵ m²) ≈ 3.9 MPa, about 39 atmospheres.
Melting-point drop: 3.9 MPa ÷ 13.5 MPa per °C ≈ 0.3 °C, using the IAPWS melting curve.
So the ice under the wire melts at about −0.3 °C. Real ice is subtler: in 1963 experiments described by Rosenberg, J. W. Telford and J. S. Turner calculated that their wire lowered the melting point by only about 0.5 °C, yet it still crept through ice as cold as −3.5 °C.
Does pressure melting explain ice skating?
Mostly, no. In 1886 engineer John Joly calculated that a skate's narrow edge presses on the ice at about 466 atmospheres, giving a melting point of −3.5 °C (Rosenberg, Physics Today). The same article notes that the optimum ice for figure skating is about −5.5 °C, for hockey about −9 °C, and that skating is possible at −30 °C. Pressure alone cannot reach those temperatures. (For why blades are narrow anyway, see why ice skaters use sharp blades.)
What does the work instead (Rosenberg):
Frictional heating. Frank Bowden and T. P. Hughes proposed in 1939 that friction from a moving blade or ski melts a thin layer. Samuel Colbeck's group later found a skate blade's temperature rose with speed.
A premelted surface. Ice carries a thin liquid-like layer even below 0 °C. Atomic force microscope measurements by Astrid Döppenschmidt and Hans-Jürgen Butt put an upper limit on its thickness of 12 nm at −24 °C, rising to 70 nm at −0.7 °C.
Mobile surface molecules. A 2018 study of steel-on-ice friction from −100 °C upwards found low friction only in the temperature range typical of skating, and linked it to how freely surface molecules move (Weber et al., Journal of Physical Chemistry Letters).
How can you try the wire-through-ice demo at home?
Use the clearest ice you can make.
Let the block sit out until its surface looks wet, so it is close to 0 °C.
Rest it across two bricks over a tub, and keep feet clear of the falling weights.
Predict first: will a copper wire or a fishing line of the same thickness get through faster? Then test it.
If the phase-diagram idea feels shaky, the Fermi Concept Library gives each concept its own lesson and its place in the map. For numericals like the one above, the Fermi Problem Library has a step-by-step solver that explains the reasoning rather than printing an answer.


