

On this page
Most liquids shrink as they cool and freeze. Water expands below about 4 °C, and far more when it turns to ice. This anomalous expansion explains frozen lakes, burst pipes and a graph that trips up many students.
Why does water expand when it freezes?
The cause is hydrogen bonding. In ice, each oxygen atom is surrounded tetrahedrally by four hydrogen atoms, two bonded covalently and two held by hydrogen bonds, and this gives ice “a rather open structure with hexagonal channels running through it”, as the LibreTexts ChemPRIME chapter on ice and water puts it. When ice melts, some hydrogen bonds break and molecules move into those empty channels, so the same mass takes up less room.
Ice at 0 °C has a density of 0.9167 g/cm³, while liquid water at the same temperature is about 0.9998 g/cm³ (Wikipedia's ice article, citing the CRC Handbook). So ice is about 8% less dense, and the same mass takes up about 9% more room. The USGS Water Science School rounds this to a density drop of “about 9 percent”.
Why is water densest at 4 °C?
Two effects compete. Warming cold water breaks more leftover hydrogen bonds, so molecules pack closer and volume falls. It also makes molecules move faster and push neighbours apart, so volume rises. Below about 4 °C the first effect wins; above it the second wins, as the LibreTexts chapter explains.
The reference formula for water density published by Tanaka and colleagues in Metrologia in 2001 puts the density maximum of water at 3.983 °C, where the density is 999.975 kg/m³ (the formula and its coefficients, as coded in the ChemPy library). Textbooks round this to 4 °C.
How do you read the graph of volume against temperature?
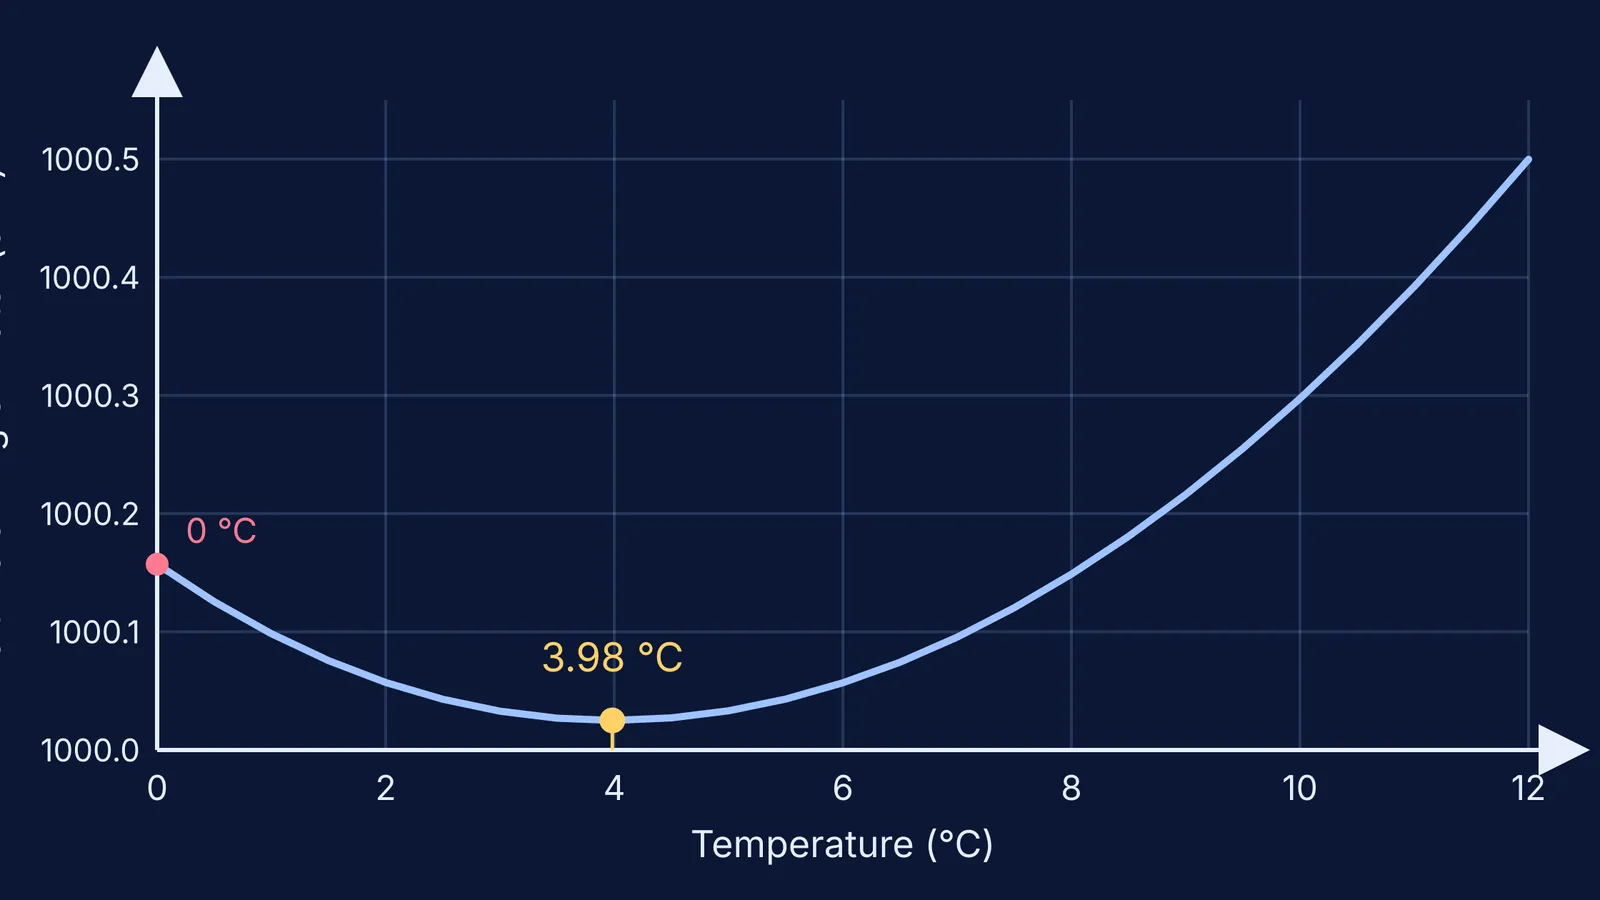
The graph at the top of this post plots the volume of 1 kg of liquid water from 0 to 12 °C, worked out from the Tanaka formula. It is a U-shaped curve with its lowest point at 3.98 °C. The density graph is the same curve flipped: a hump peaking at 3.98 °C. Exam options showing a dip in density, or the smallest volume at 0 °C, are the usual traps.
Worked example: you fill a sealed 1-litre steel bottle with water at 4 °C and put it in the freezer.
Mass: the USGS density table gives 1.00000 g/cm³ at 4 °C, so the bottle holds about 1000 g.
Cooling to 0 °C, still liquid: from the Tanaka formula, the volume of 1 kg rises from 1000.025 cm³ to 1000.157 cm³, a gain of only about 0.13 cm³.
Freezing at 0 °C: the ice would need mass ÷ density = 1000 g ÷ 0.9167 g/cm³ ≈ 1091 cm³ (CRC value via Wikipedia), about 91 cm³ more than the bottle holds.
Compare: freezing adds roughly 700 times more volume than the whole anomalous stretch from 4 °C to 0 °C.
Why do lakes freeze from the top down?
In autumn, chilled surface water gets denser and sinks, so water near 4 °C collects at the bottom. Once the surface cools below 4 °C it is lighter than the water beneath, so it stays on top and freezes there. The USGS points out that if water were densest at its freezing point, the coldest water would sink and a lake could freeze from the bottom up.
Instead, 4 °C water sits at the bottom of deep lakes and floating ice insulates the water below from winter air, so the lake freezes far more slowly and fish are spared long periods of freezing (LibreTexts). How quickly that ice layer thickens is a heat conduction problem, worked through in our post on the time for ice to form on a pond.
Why do frozen pipes burst?
Mostly not because of ice pressing on the wall. A 1996 report by Jeffrey Gordon for the Insurance Institute for Property Loss Reduction found that “the pressurization of liquid water, rather than the radial expansion of ice in the frozen portion of the pipe, causes most bursting”, as summarised by Green Building Advisor. An ice plug forms, water is trapped between it and a closed tap, and further freezing squeezes that nearly incompressible water until the pipe gives way. Blocked expansion builds force in solids too: see thermal stress in clamped rods.
What should you write in an exam answer?
Name the cause: hydrogen bonds give ice an open hexagonal lattice.
Give the numbers: maximum density near 4 °C, and ice about 9% bigger in volume than the water.
Draw the volume graph with a minimum at 4 °C, or the density graph with a maximum.
For a lake, label the layers: ice on top, 0 °C water just under it, 4 °C water at the bottom.
For a pipe, describe water trapped between an ice plug and a closed end.
If one link in that chain feels fuzzy, the Fermi Concept Library gives each concept in physics and chemistry its own lesson and its place in the map. To practise, the Fermi Problem Library has worked problems with a step-by-step solver that explains the reasoning rather than printing an answer.


