
On this page
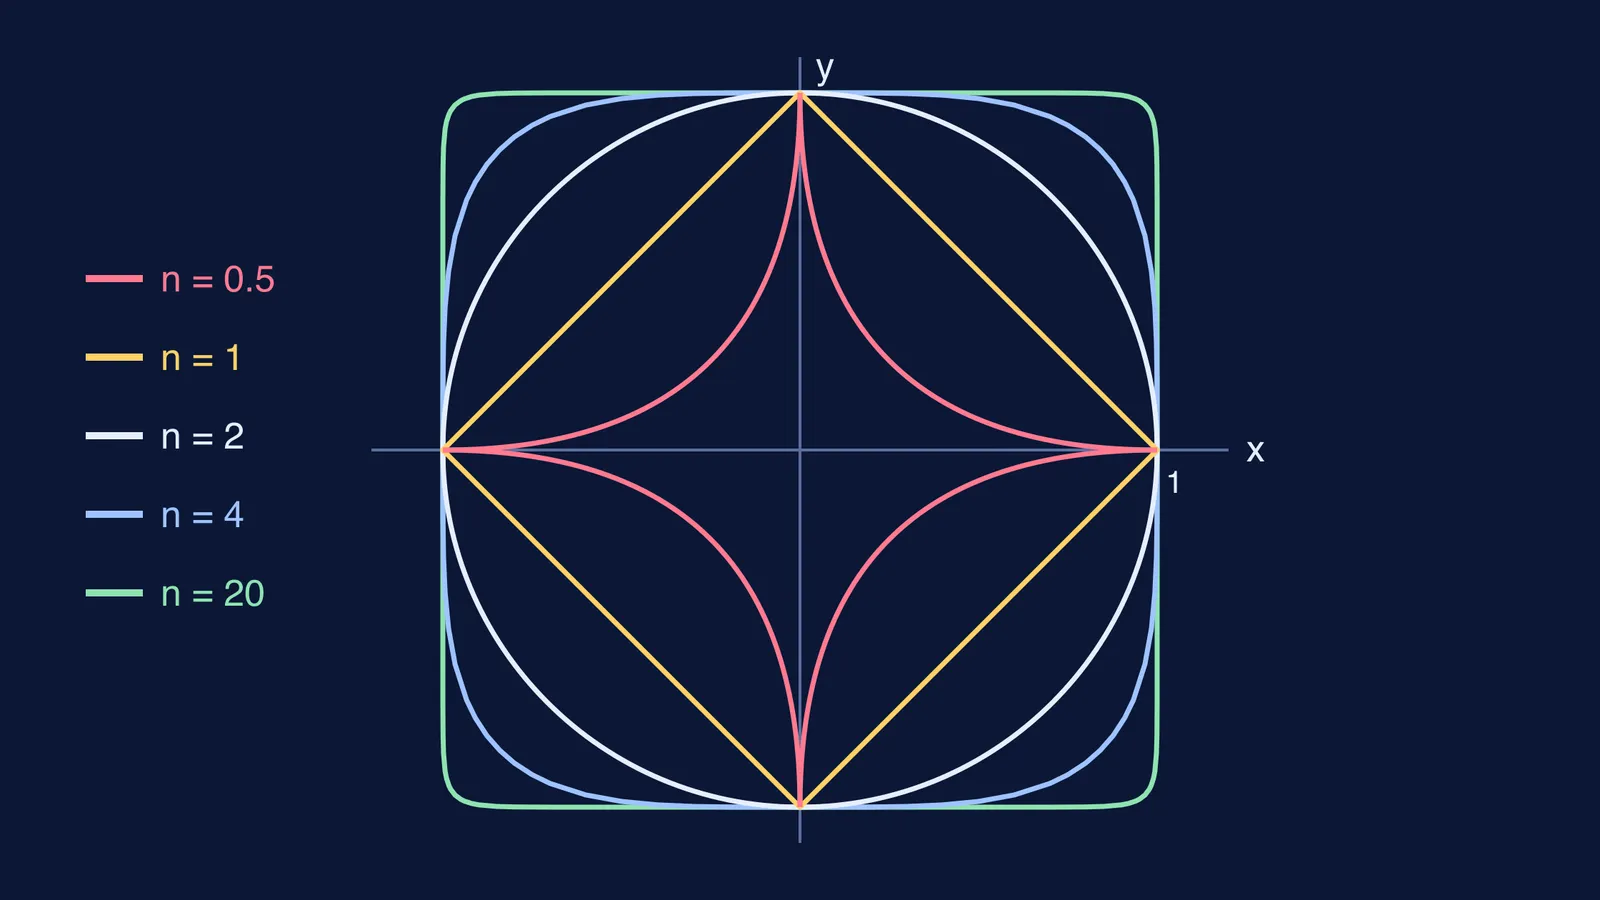
Most students meet x² + y² = 1 as the unit circle. Change the 2 and one equation draws a whole family of shapes. Below you will plot five of them and find the two shapes the family never quite reaches.
What does x^n + y^n = 1 look like for different n?
The general curve is written |x/a|^n + |y/b|^n = 1 and is called a superellipse, or a Lamé curve after Gabriel Lamé (1795 to 1870), according to Wikipedia's superellipse article. Here we take a = b = 1, so the curve always passes through (1, 0), (0, 1), (−1, 0) and (0, −1). The absolute values matter: for n = 0.5, a negative x has no real x^n, so using |x| makes the shape symmetric in all four quadrants.
The same article describes each range of n:
0 < n < 1: a four-armed star with concave, inward-curved sides.
n = 1: a rhombus with corners on the axes; with a = b it is a square standing on one corner, the diamond.
n = 2: an ordinary ellipse, which is a circle when a = b.
n > 2: something that looks like a rectangle with rounded corners.
Wolfram MathWorld adds that for even whole-number powers the curve gets closer to a rectangle as the power increases.
How do you plot x^n + y^n = 1 point by point?
Work in the first quadrant, where x and y are both between 0 and 1. Solve for y:
y = (1 − x^n)^(1/n)
Work out y, then mirror the points into the other three quadrants. Values to three decimal places for x = 0, 0.25, 0.5, 0.75, 0.9 and 1:
n = 0.5: y = 1, 0.25, 0.086, 0.018, 0.003, 0
n = 1: y = 1, 0.75, 0.5, 0.25, 0.1, 0
n = 2: y = 1, 0.968, 0.866, 0.661, 0.436, 0
n = 4: y = 1, 0.999, 0.984, 0.909, 0.766, 0
n = 20: y = 1, 1.000, 1.000, 1.000, 0.994, 0
One extra point tells you the most. Where the curve crosses y = x, 2x^n = 1, so x = y = 2^(−1/n). That gives 0.25, 0.5, 0.707, 0.841 and 0.966 for our five values of n: the curve walks out along the diagonal towards the square's corner at 1.
Why does a bigger n push the curve outwards?
For any number between 0 and 1, raising it to a higher power makes it smaller: 0.75² is 0.5625, but 0.75²⁰ is about 0.003. So for a fixed x, x^n uses up less of the total of 1 as n grows, leaving more room for y. The curve bulges outwards. When n is below 1 the opposite happens: x^n is bigger than x, it eats almost the whole 1, and y is squeezed towards zero.
What shapes does it approach as n goes to 0 and to infinity?
As n grows without limit, whichever of |x| and |y| is larger dominates the sum. The equation becomes max(|x|, |y|) = 1, which is the square with corners at (±1, ±1).
As n shrinks towards 0, any number between 0 and 1 raised to a tiny power is close to 1, so any point off the axes gives a sum near 2, which is too big. Only the axes survive: the star thins into a plus sign, the two axis segments from −1 to 1.
The enclosed area is 4ab[Γ(1 + 1/n)]² / Γ(1 + 2/n), where Γ is the gamma function (Wikipedia). With a = b = 1 this gives about 0.667, 2, π, 3.708 and 3.985 for n = 0.5, 1, 2, 4 and 20: heading to 4 (the square) at one end and 0 (the plus sign) at the other.
Where does this curve show up in real life?
In 1959, city planners in Stockholm announced a design challenge for a roundabout at Sergels Torg. The winning proposal, by the Danish poet and scientist Piet Hein, was a superellipse with n = 2.5 and a/b = 6/5, according to Wikipedia. MathWorld notes he also used n = 2.5, with a/b = 3/2, for a table.
A 15-minute plan to see it for yourself
On graph paper, with 5 cm as 1 unit, plot the n = 1 and n = 2 points in different colours.
Predict where n = 4 crosses y = x, then check against 0.841.
Type |x|^n + |y|^n = 1 into a graphing tool with a slider for n and drag it from 0.2 to 30.
If you like seeing an idea move before you calculate it, the Fermi Simulation Lab has interactive simulations for ideas that are easier to see than to read. For another curve that changes shape with one number, read why r = sin 2θ has 4 petals but r = sin 3θ has 3, or go back to basics with why x = 2 is a line parallel to the y-axis.