
On this page
You write x = 2, and your teacher draws a full vertical line across the graph. One number, and you get a whole line? Plot it yourself, point by point, and it makes sense. It also explains a common textbook question: show y = 3 in one variable and in two variables.
Why is x = 2 a line parallel to the y-axis?
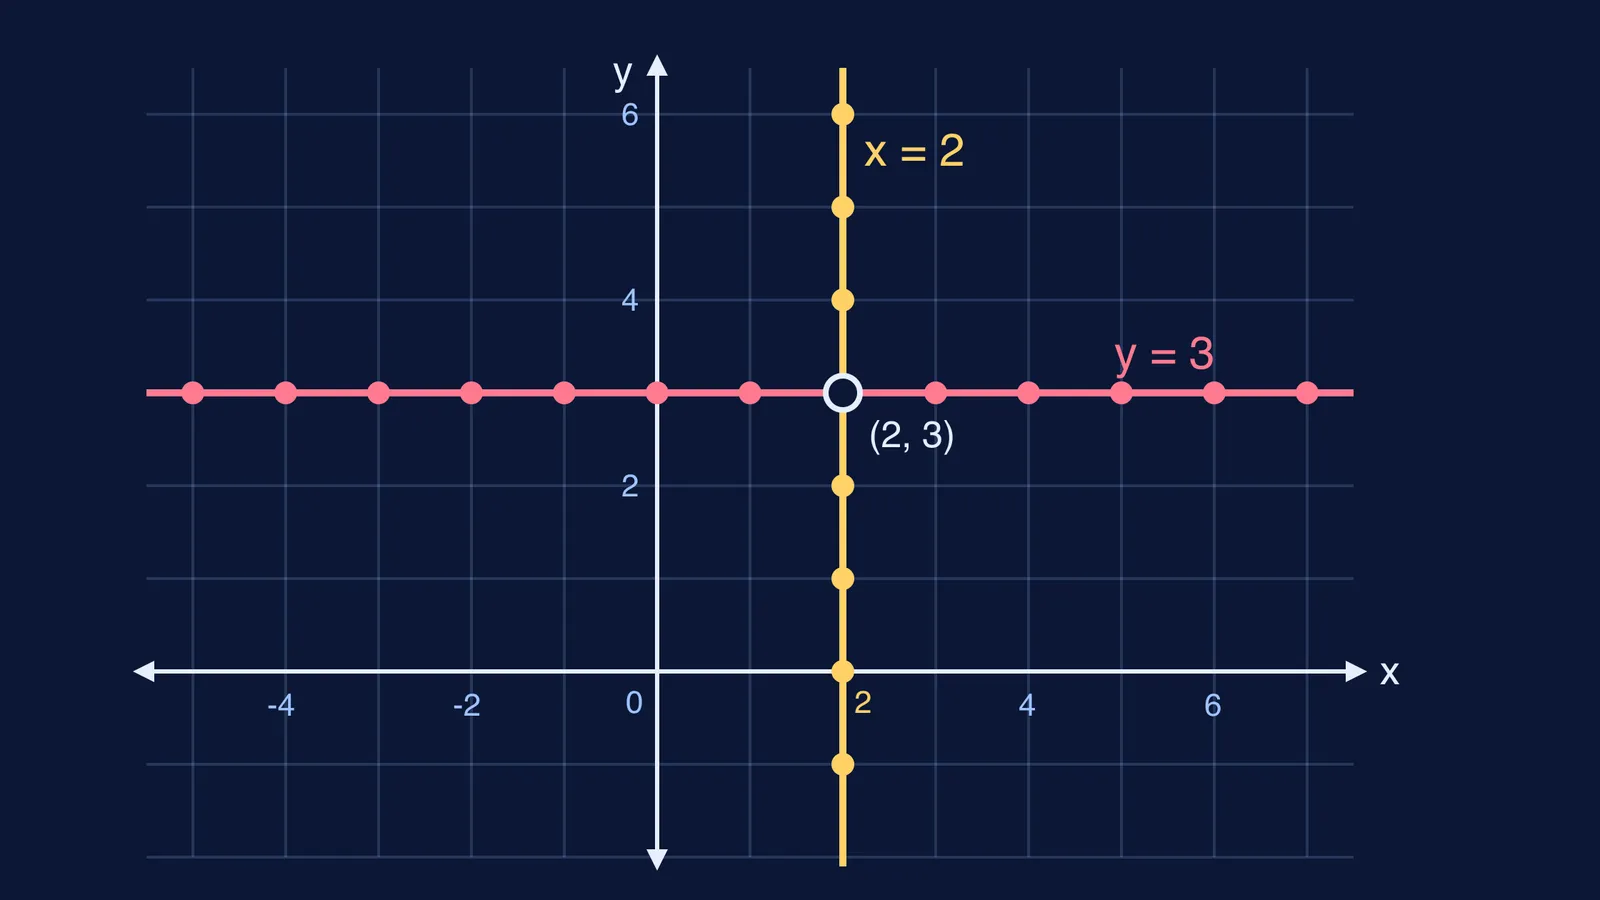
On the coordinate plane, every point needs two numbers, x and y. The equation x = 2 puts a condition on x only. It says nothing about y, so y can be anything.
Pick some values of y:
y = −1 gives (2, −1)
y = 0 gives (2, 0)
y = 1 gives (2, 1)
y = 3 gives (2, 3)
y = 5 gives (2, 5)
Every point is exactly 2 units to the right of the y-axis. Points that stay the same distance from a line at every height lie on a line parallel to it. Join them and you get a vertical line that crosses the x-axis at (2, 0) and never meets the y-axis.
The open textbook Elementary Algebra 2e from OpenStax puts it as a definition: a vertical line is the graph of an equation of the form x = a, and it passes through the x-axis at (a, 0).
x = 2 is still a linear equation in two variables: write it as 1x + 0y = 2. The same OpenStax section states that the graph of Ax + By = C is a line and every point on it is a solution. With B = 0, the line is vertical.
Why is y = 3 parallel to the x-axis?
Now flip it: y is fixed and x is free.
x = −2 gives (−2, 3)
x = 0 gives (0, 3)
x = 2 gives (2, 3)
x = 4 gives (4, 3)
All of these sit 3 units above the x-axis, so they form a horizontal line through (0, 3). The OpenStax text gives the matching definition: a horizontal line is the graph of an equation of the form y = b, and it passes through the y-axis at (0, b).
Put both lines on one graph and they cross only at (2, 3), the one point that satisfies both equations.
How do you show y = 3 in one variable and in two variables?
The number of variables decides the picture. In one variable, y = 3 has one solution: a single point. In two variables, every solution is a pair (x, y), one for every x: a line. An answer layout for the exam:
In one variable: y = 3 has the unique solution y = 3. Draw a number line and mark the point 3.
In two variables: write the equation as 0x + 1y = 3.
Make a table of at least three solutions, for example (0, 3), (2, 3) and (−2, 3).
Plot the points, join them and extend the line with arrows at both ends.
State the result: the graph is a straight line parallel to the x-axis, 3 units above it.
For 2x − 4 = 0, solve first to get x = 2: a point on the number line in one variable, the vertical line above in two.
Where do students usually lose marks?
Check these before you hand in a graph question:
For x = 2 in two variables, did you draw a line, not just the point (2, 0)?
Is x = 2 vertical? An easy slip is drawing it horizontal because it has an x in it.
Did you show the table and the hidden zero term, such as 0x + y = 3?
Did you label the line and add arrows at both ends?
Special cases: x = 0 is the y-axis itself and y = 0 is the x-axis itself.
Related reading: solutions of a linear equation in two variables, graphing a linear equation using its intercepts and abscissa, ordinate and signs in each quadrant.
What does this lead to next?
These lines return in pairs of linear equations. x = 2 and y = 3 meet once, so the pair has one solution. x = 2 and x = 5 are both vertical and never meet, so the pair has no solution.
To revise coordinate geometry one idea at a time, the Fermi Concept Library gives each mathematics concept its own lesson and its place in the map. When a graph question goes wrong, the Fermi Problem Library has worked problems with a step-by-step solver that explains the reasoning rather than printing an answer.
Try it now: draw x = −1 and y = 4 on one graph, make a table for each, and predict where they cross before you plot.