

On this page
The moment you see an equation like 3x + 2y = 12, you know its graph will be a straight line. According to the CBSE Class 9 Mathematics syllabus, students dedicate 16 periods to the algebra of linear equations, proving that every solution forms a straight line on the Cartesian plane (CBSE, 2024).
While you could pick random numbers for x and solve for y to find coordinates, calculating fractions or large numbers slows you down during an exam. The fastest and most reliable way to plot a line is the intercept method.
What is the intercept method?
A straight line crosses the axes at two specific points: the x-intercept and the y-intercept. Because these points lie directly on the axes, one of their coordinates is always zero. This makes the arithmetic much simpler.
To find the y-intercept: Set x = 0 and solve for y. This gives you the point (0, y).
To find the x-intercept: Set y = 0 and solve for x. This gives you the point (x, 0).
Plotting these two points is enough to draw the line. However, to guarantee you haven't made a calculation error, you should always find a third "check point." If all three points lie on the same straight line, your graph is correct.
How to draw the graph of a linear equation quickly?
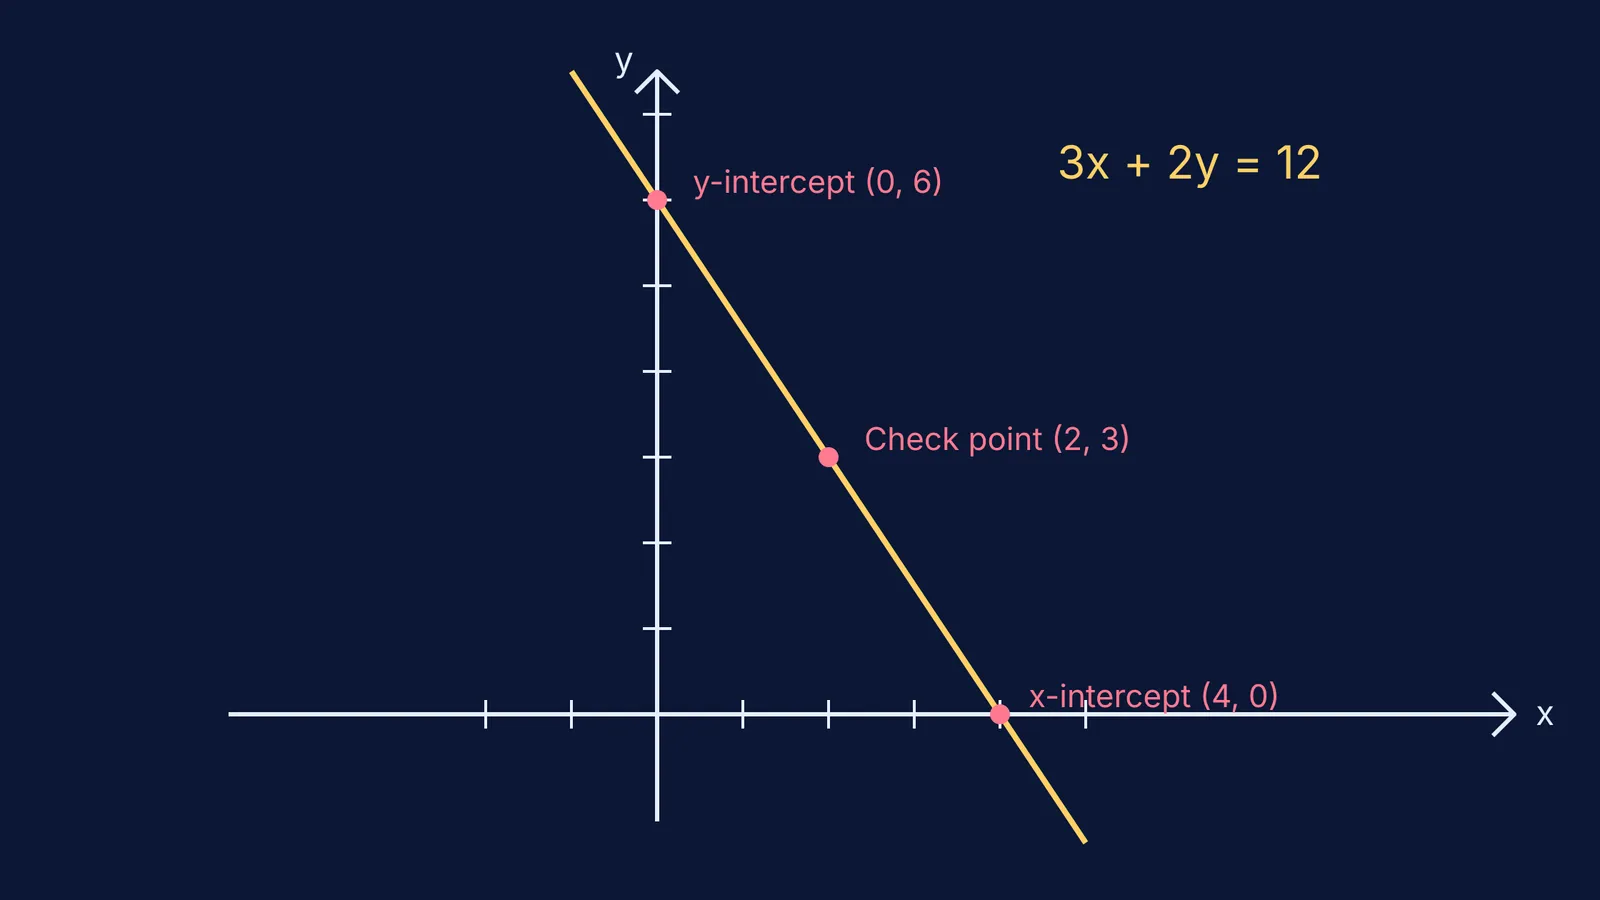
Let's use the intercept method to graph the equation 3x + 2y = 12.
1. Find where it crosses the y-axis Set x to 0: 3(0) + 2y = 12 2y = 12 y = 6 Your first point is (0, 6).
2. Find where it crosses the x-axis Set y to 0: 3x + 2(0) = 12 3x = 12 x = 4 Your second point is (4, 0).
3. Find a check point Pick a small, easy number for x, like x = 2: 3(2) + 2y = 12 6 + 2y = 12 2y = 6 y = 3 Your check point is (2, 3).
Plot (0, 6), (4, 0) and (2, 3) on your graph paper. Place your ruler against them. Because they form a perfectly straight line, you can draw the line with confidence.
What if the line goes through the origin?
The intercept method has one exception. If your equation has no constant term—for example, y = 2x or 3x - y = 0—the line passes exactly through the origin (0, 0).
If you set x to 0, you get y = 0. If you set y to 0, you get x = 0. The x-intercept and y-intercept are the exact same point.
In this case, you cannot draw a line with just one point. You must pick two other values for x.
Let x = 1. Then y = 2(1) = 2. Point: (1, 2).
Let x = -1. Then y = 2(-1) = -2. Point: (-1, -2).
Plot (0, 0), (1, 2) and (-1, -2) to draw the line.
If you struggle to see why a graph behaves a certain way or have trouble rearranging the equation, Fermi's AI tutor can work out what you already know and build a plan for the session, so you sit down to a clear next step.
How can you check your work?
Graphing linear equations is the foundation for later topics, such as solving simultaneous equations. You can review how these tie together in our guide to Linear equations in Class 10: substitution, elimination, graphs.
If you have a more complex equation with fractions or decimals, you might want to verify your algebra before plotting. The Fermi Problem Library has a step-by-step solver that explains the reasoning rather than just printing an answer.
For a broader look at the chapter's basics, see our overview of Linear equations in two variables in Class 9: graphs and solutions.


