On this page
You can predict every asymptote of a rational function before you plot a single point. It comes down to two checks: where the simplified denominator is zero, and how the degree of the top compares with the degree of the bottom. Below are the rules and a six-round slider exercise: predict first, check second.
How do you find the vertical asymptotes of a rational function?
A rational function is one that can be written as a quotient of two polynomials, P(x)/Q(x), as defined in OpenStax Precalculus 2e. A vertical asymptote is a line x = a where the graph heads towards positive or negative infinity as x approaches a.
The textbook's method comes down to three steps:
Factor the numerator and the denominator.
Cancel any factor they share. If that factor is gone from the denominator after cancelling, it leaves a hole (a removable discontinuity), not an asymptote.
Set each remaining denominator factor to zero. Those x-values are the vertical asymptotes.
So (x² − 4)/(x − 2) has no vertical asymptote. It equals x + 2 everywhere except x = 2, where the graph has one missing point at (2, 4).
How do degrees decide the horizontal or slant asymptote?
Call the numerator's degree n and the denominator's degree m. OpenStax Precalculus gives three cases, and its rule on end behaviour covers a fourth:
n less than m: the horizontal asymptote is y = 0.
n equal to m: the horizontal asymptote is y = (leading coefficient of the top) ÷ (leading coefficient of the bottom).
n equal to m + 1: there is no horizontal asymptote. Divide the polynomials, and the quotient (ignoring the remainder) is the slant asymptote.
n more than m + 1: there is no horizontal or slant line. Far from the origin, the graph behaves like the leading term of the top divided by the leading term of the bottom.
Every case has the same cause: when x is very large, only the leading terms matter. Our explainer on the limit of a rational function as x tends to infinity works through that limit step by step.
Slider exercise: what happens when you change the degrees?
Open a graphing tool with sliders. Our guide to using sliders in a graphing calculator shows how to set one up. Keep the denominator at x − 2 and change only the numerator at first. Write your prediction for each round on paper before you look at the graph.
3/(x − 2). Degrees 0 and 1. Prediction: vertical x = 2, horizontal y = 0.
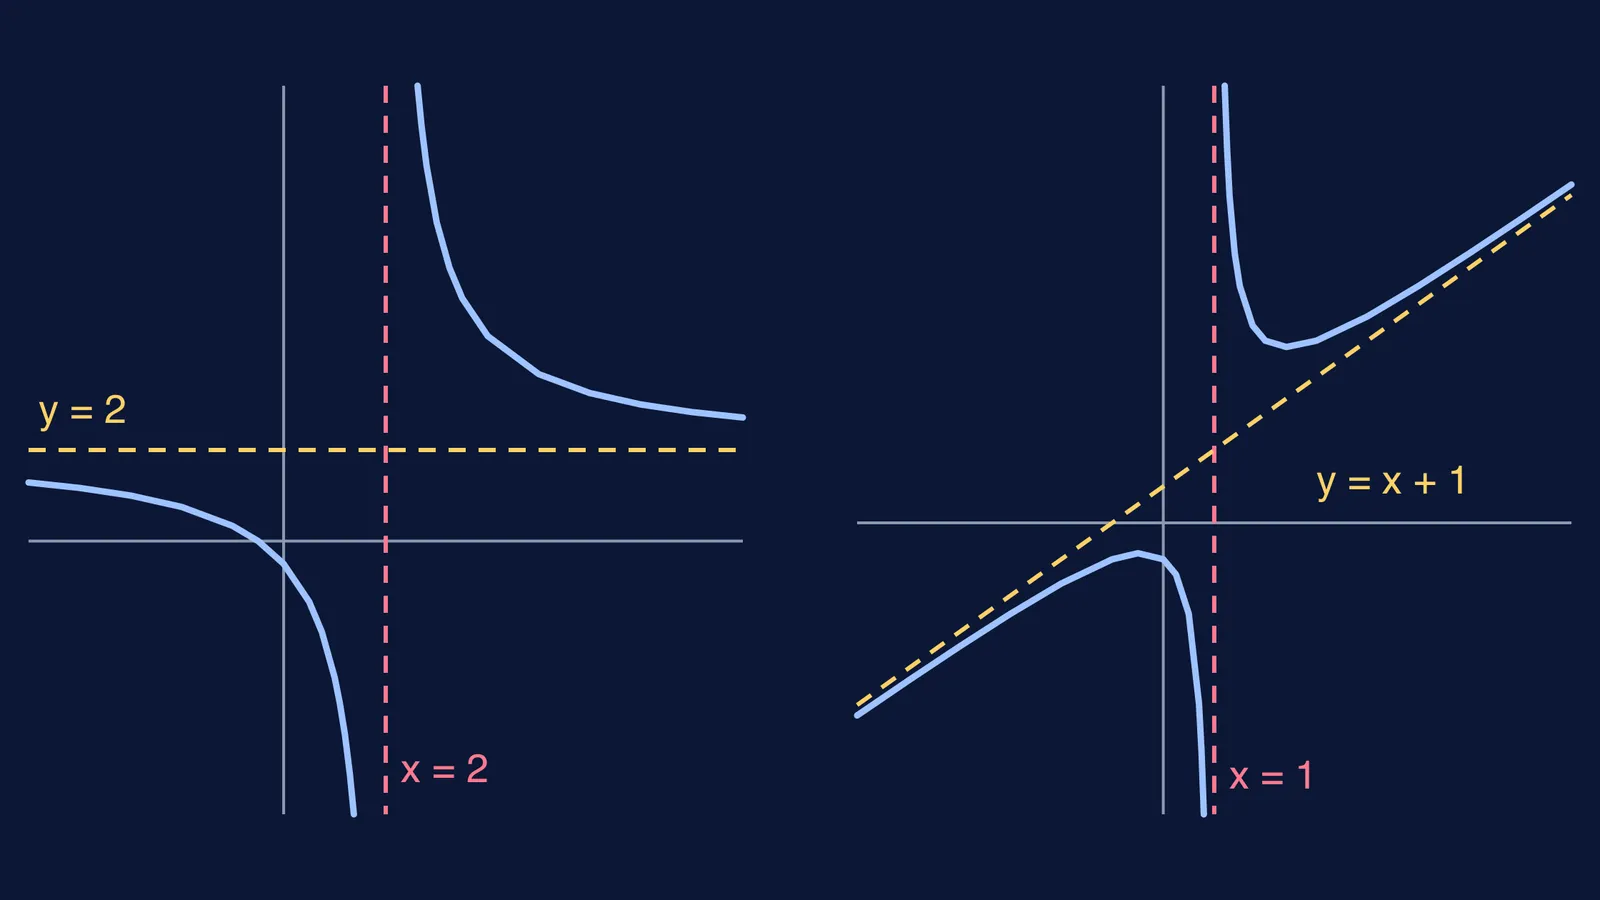
(2x + 1)/(x − 2). Degrees 1 and 1. Prediction: vertical x = 2, horizontal y = 2/1 = 2.
(x² + 1)/(x − 2). Degrees 2 and 1. Divide: x² + 1 = (x − 2)(x + 2) + 5, so the slant asymptote is y = x + 2.
x³/(x − 2). Degrees 3 and 1. No horizontal or slant line. Far out, the graph behaves like x³/x = x², so both ends rise.
(2x + 1)/(x² − 4). Now the bottom has degree 2. Prediction: vertical x = 2 and x = −2, horizontal y = 0.
(x² − 4)/(x − 2). Prediction: no vertical asymptote, just a hole at (2, 4).
Round 6 is the easy one to miss. The denominator is zero at x = 2, but that factor cancels, so the graph is a straight line with a gap rather than a curve splitting in two. If a graph surprised you, find the rule you missed.
Can a graph cross its asymptote?
A graph can cross a horizontal or slant asymptote, but it never crosses a vertical one, OpenStax notes. Take round 5: (2x + 1)/(x² − 4) is zero at x = −1/2, so it crosses y = 0 there, and it still approaches y = 0 at both ends. A horizontal asymptote describes the ends of the graph, not the middle. For a full curve with both a vertical and a slant asymptote, see our walk-through of sketching y = x + 1/x.
Why predict before you move the slider?
In a study in the American Journal of Physics, Catherine Crouch, Eric Mazur and colleagues found that students who only watched classroom demonstrations understood the underlying concepts no better than students who did not see the demonstration at all. Students who predicted the outcome before seeing it showed significantly greater understanding. Their study used physics demonstrations, not graphs, but the habit is worth trying here: a wrong prediction you wrote down is one you can fix.
The Fermi Simulation Lab has interactive simulations for ideas that are easier to see than to read, and the same routine works there: predict, change one thing, check. If the slant case keeps tripping you up, Fermi's AI tutor notices where you are stuck and decides whether to explain, ask or show.
Try round 6 tonight. If you predicted a hole and not an asymptote, you have the rule.