

On this page
Most students learn y = a sin(bx + c) as three rules to memorise: a stretches, b squeezes, c shifts. With sliders you can watch each rule happen, but only if you guess first.
How do you add sliders in a graphing calculator?
In GeoGebra and similar tools, you type an equation with letters in it and the tool offers each unknown letter as a slider. The GeoGebra manual says that whenever you create a free number in the Algebra View, a slider for it appears, and you can set its interval, increment and animation speed (GeoGebra manual: Slider tool).
Type y = a sin(bx + c) and accept sliders for a, b and c.
Set a from −3 to 3, b from 0 to 4, and c from −π to π in steps of π/12.
Also graph y = sin x in a second colour and leave it alone. It is your reference curve.
Start at a = 1, b = 1, c = 0, so the two curves sit on top of each other.
Why predict before you drag the slider?
Watching a curve move is pleasant, and it is easy to mistake that for learning. In a 2004 study in the American Journal of Physics, Catherine Crouch, Adam Fagen, Paul Callan and Eric Mazur compared ways of presenting classroom demonstrations (Crouch et al., 2004). Students who only watched a demonstration understood the idea no better than students who never saw it. Students who predicted the outcome first showed significantly greater understanding.
A slider is a demonstration you run yourself. Before each drag, write one line: what will move, which way, and by how much. Then drag and mark it right or wrong.
What do a, b and c do in y = a sin(bx + c)?
Move one slider at a time, and reset the others to their starting values each time.
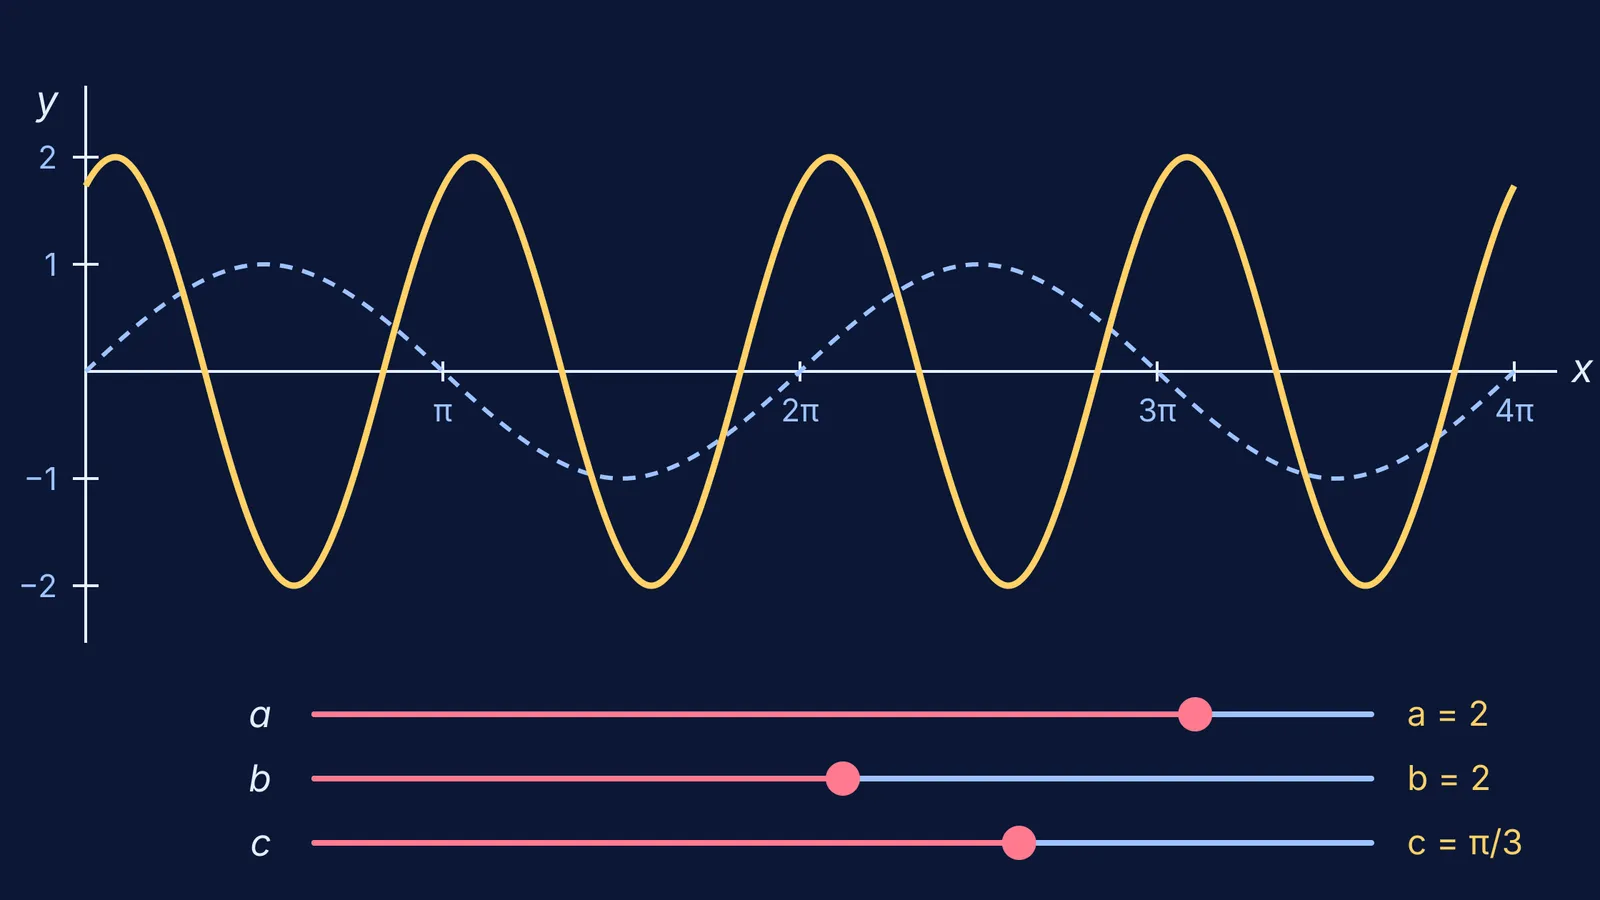
a from 1 to 2. Predict: the peaks rise to 2, the troughs fall to −2, and the zeros stay put. The amplitude is |a|.
a from 1 to −1. Predict: the curve flips upside down about the x-axis.
b from 1 to 2. Predict: twice as many waves in the same space. The period is 2π/b, so it drops from 2π to π.
c from 0 to π/3, with b = 1. Predict: the curve moves left by π/3. A plus sign means a leftward shift, which is easy to get backwards.
The trap: b = 2 and c = π/3. Predict where the curve crosses zero on its way up. Rewrite y = sin(2x + π/3) as y = sin 2(x + π/6). The shift is c/b = π/6, not π/3, so the rising zero nearest the origin sits at x = −π/6.
Step 5 is where the exercise pays off. If you predicted π/3, the slider just caught an error that is easy to make in board exam and JEE graph questions. For more shifts, reflections and modulus graphs, see our guide to graph transformations for JEE.
How do you design your own slider exploration for any formula?
Put a slider on one letter you usually treat as "just a number". Keep a frozen copy of the original curve.
Choose a range that includes zero, negative values, and a value where you expect something special.
Write predictions for three slider positions before you touch it.
Drag. For every miss, write one sentence explaining why the formula did what it did.
Close the tool and sketch the curve for a new value from memory.
Three formulas to try next:
y = a(x − h)² + k, sliding h to 3. Does the vertex move left or right, despite the minus sign?
y = x² + bx + 1, sliding only b. Watch the vertex: it traces a parabola of its own, y = 1 − x².
Projectile range R = u² sin 2θ / g, sliding θ from 0° to 90°. Which angle gives the largest range, and which pairs give equal ranges?
Where do sliders stop helping?
A slider shows what a formula does, not why. Once a slider surprises you, go back to the algebra and work out the reason. Our guide to using graphing tools to learn functions and calculus, not skip them builds this habit further, and our summary of what PhET research says interactive simulations are good for covers the classroom evidence.
Some ideas, like waves, fields and orbits, are easier to see moving than to read on a page. The Fermi Simulation Lab has interactive simulations for those ideas. If step 5 keeps tripping you up, Fermi's AI tutor notices where you are stuck and decides whether to explain, ask or show.
Pick one formula from your current chapter: one slider, three written predictions, one sketch from memory.


