
On this page
Stretch a rubber band twice as far: does the pellet fly twice as fast, or four times as fast? You can settle it with a ruler, a spring balance and an afternoon. Write your prediction down before you read on, because the gap between prediction and data is where the learning happens.
What happens to launch speed when you stretch a band twice as far?
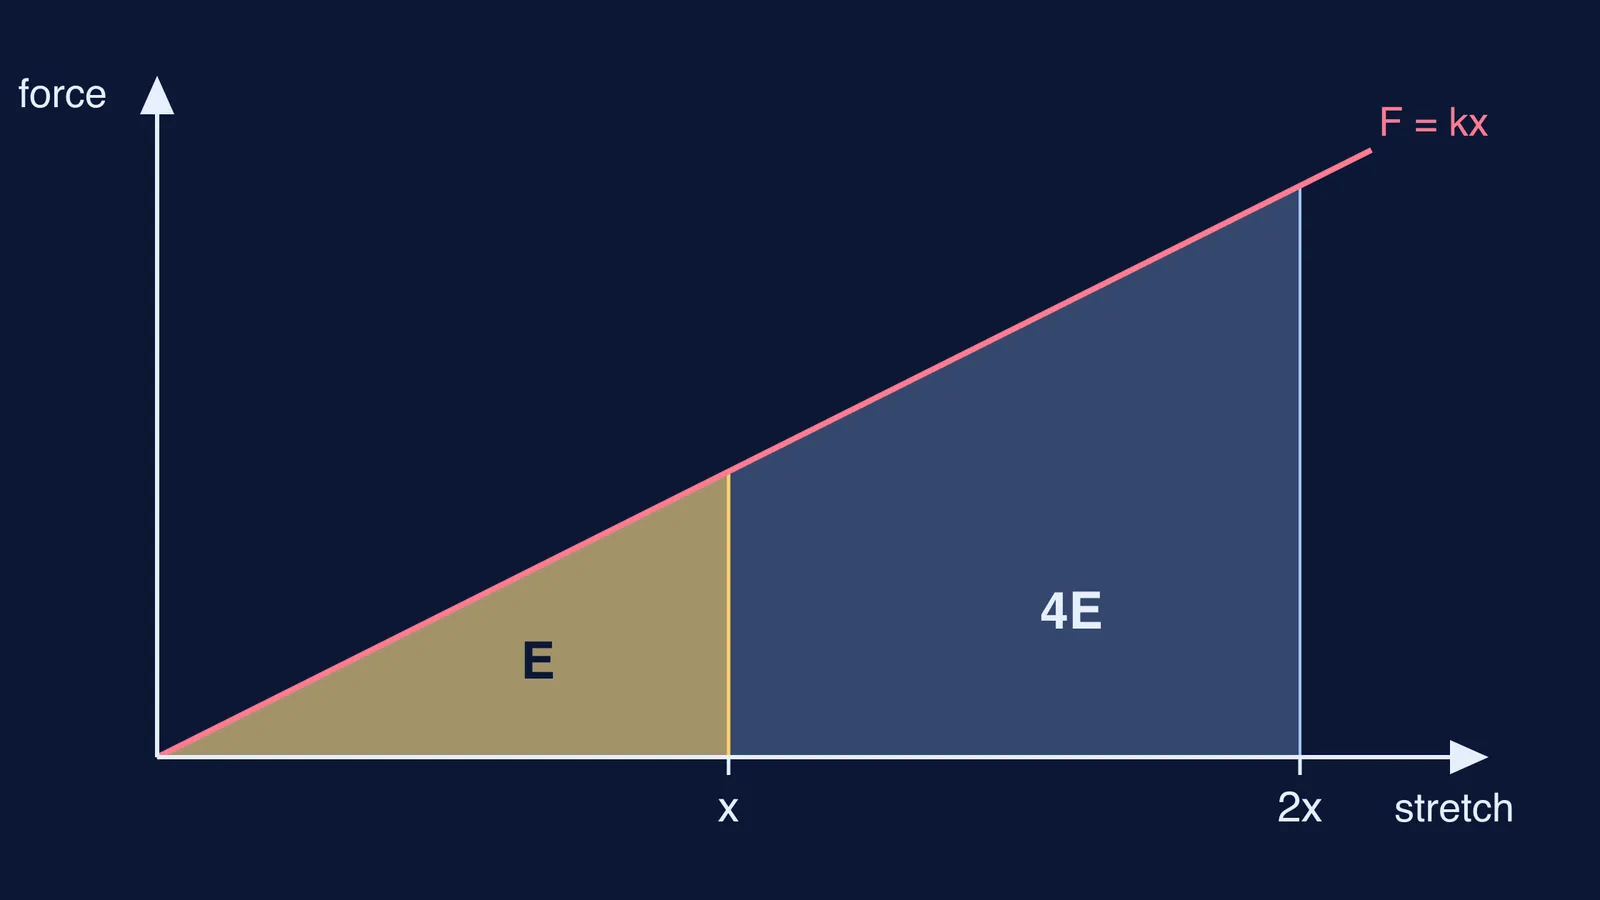
Start with the ideal case: a band that behaves like a perfect spring. The elastic potential energy of a spring is U = ½kx², where k is the spring constant and x is the stretch, as set out in OpenStax University Physics, section 8.1. Because x is squared, doubling the stretch stores four times the energy.
Kinetic energy is K = ½mv², according to OpenStax University Physics, section 7.2. Speed is squared here too. So if four times the energy goes into the same pellet, the speed only doubles.
Put the two together and the squares cancel: in the ideal model, launch speed is proportional to stretch. Twice the stretch, twice the speed.
Here is the trap. On level ground with no air resistance, range is R = v₀² sin(2θ)/g, per OpenStax University Physics, section 4.3. Doubling the speed gives about four times the range, which can fool you into thinking the pellet went four times as fast.
How much energy reaches the pellet from a real band?
Suppose your band has k = 100 N/m and fires a 5 g paper pellet at 45°. These are made-up values.
Stretch 10 cm: U = ½ × 100 × 0.10² = 0.5 J.
Stretch 20 cm: U = ½ × 100 × 0.20² = 2 J, four times as much.
If all of it reached the pellet, v = √(2U/m) gives about 14 m/s and 28 m/s.
That is not what you will see, because most of the energy never reaches the pellet. In an MIT BLOSSOMS elasticity lesson, its author, Sourish Chakravarty, reported that in his own experiment only 7% of the elastic potential energy stored in the stretched band was converted to the projectile's kinetic energy at launch (teacher's guide, PDF). Treat 7% as an illustration, not a constant for your band.
At 10 cm, 7% of 0.5 J is 0.035 J, so v ≈ 3.7 m/s and the 45° range is about v²/g ≈ 1.4 m.
At 20 cm, 7% of 2 J is 0.14 J, so v ≈ 7.5 m/s and the range is about 5.7 m.
The speed ratio is still 2 and the range ratio is still 4, but only if the same fraction of energy reaches the pellet at both stretches. That is the assumption your experiment tests.
Why might your real catapult disagree?
Rubber is not a spring. In a force sensor experiment written up by Vernier, the rubber band did not obey Hooke's law, giving a non-linear relationship between force and extension. The same experiment found more force during loading than unloading, which means some energy was lost on the way back. That loss is called hysteresis, and schoolphysics explains that the area between the two curves on a force-extension graph is energy turned into heat. The same page suggests stretching a band and holding it to your lips to detect a rise in temperature; we explore why in why a rubber band warms when stretched.
Two more reasons your ratio may miss 2:
The band has mass and moves too, so it keeps some kinetic energy.
Air drag grows with speed, so long shots fall short.
How do you test it at home?
Hang the band from a hook and pull it with a spring balance. Record force every 2 cm up to your largest stretch.
Plot force against stretch. Find stored energy as the area under the curve, adding up thin trapezoids instead of using ½kx².
Fire a light pellet at 45° from floor level at stretches of 10, 15 and 20 cm, five shots each. Average the range.
Convert each average range to launch speed with v = √(gR).
Compare: is the 20 cm speed close to twice the 10 cm speed? Is the 20 cm stored energy more or less than four times the 10 cm value?
If your speeds rise slower than the stretch, plot log speed against log stretch: the slope is the exponent, as shown in our guide to finding the exponent hidden in lab data with log-log graphs. Aim away from people and wear glasses if you have them.
How can you see the ideal case before you build?
Our Hooke's law simulation on spring extension and the elastic limit walks through that graph. The Fermi Simulation Lab has interactive simulations for ideas that are easier to see than to read, so you can predict and check before you pick up a single band.