
On this page
A row of falling dominoes is a wave that settles to a steady speed after a run-up. Physicists write that speed as a number times √(gH), where g is 9.8 m/s² and H is the domino height, as J. M. J. van Leeuwen of Leiden University does in The Domino Effect. Spacing changes the number, and you can measure how with a ruler, a phone and a box of dominoes.
How does spacing affect the speed of falling dominoes?
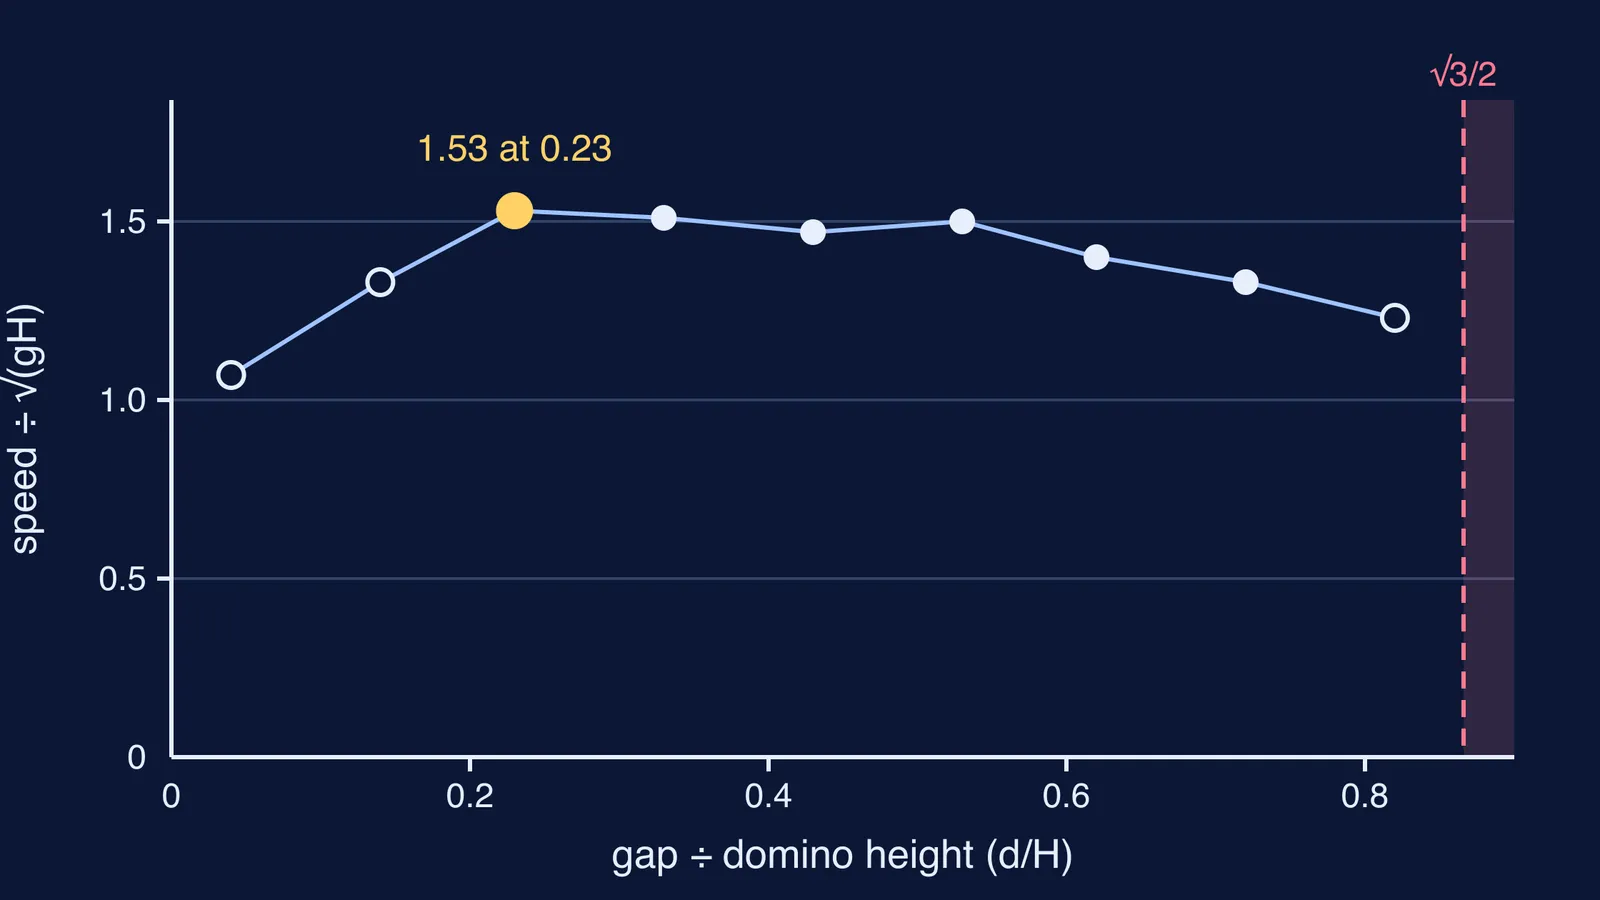
Ron Larham, then at BAE Systems in the UK, timed domino waves by recording their clatter with an old laptop's sound recorder and analysing the rhythm of the clicks. He published his numbers in Validation of a Model of the Domino Effect? in 2008. With the dominoes standing upright, his wave ran at 1.07 √(gH) when the gap was 0.04 of the height, rose to 1.53 √(gH) at a gap of 0.23, and fell back to 1.23 √(gH) at 0.82. He marked the runs at 0.04, 0.14 and 0.82 as less reliable.
The middle is surprisingly flat. For gaps between 0.23 and 0.53 of the height, Larham's speeds stayed between 1.47 and 1.53 √(gH). Plotting his runs alongside other published experiments, he found all the reliable points between roughly 1 and 1.6 √(gH), with a weak dependence on spacing for most data sets. So the fastest gap is a broad plateau, and since it rests on one person's runs, treat 0.23 as a guide.
Why is there a fastest gap?
Theory pins down the limits more firmly than the peak. In van Leeuwen's model, the front domino rotates through an angle θ, where sin θ = gap ÷ height, before it hits the next one. A gap of 0.23H means about 13°; a gap of 0.5H means 30°.
Very small gaps: below a minimum gap the model shows no domino effect, and just above it the wave struggles to get going. With a friction coefficient of 0.2 between dominoes, he found no domino effect below about 0.07 of the height.
Wide gaps: above √3/2, about 0.87 of the height, the strike lands below the neighbour's centre of mass, so it may slide instead of tipping (see toppling versus sliding).
Energy passed along. Between hits, gravity turns each domino's potential energy into rotation. The hits themselves are inelastic: the falling domino keeps leaning on the next one, and van Leeuwen calls the collisions "the main dissipative element, more than the inclusion of friction." In the steady wave, the energy each domino releases balances what the collisions throw away. For why a tipped domino falls once its centre of mass passes the pivot, see stable, unstable and neutral equilibrium.
Where the peak sits is not settled. Van Leeuwen's calculated speeds are highest near the smallest workable gap, while Larham measured slower waves at his two closest gaps, the runs he trusted least.
How do you time a 1 m domino run at home?
Here is a plan, worked through for dominoes 5 cm tall. Measure yours and scale the gaps.
Measure the height H. For H = 5 cm, test gaps of 0.1H to 0.8H: 5, 10, 15, 20, 25, 30, 35 and 40 mm. Cut a card spacer for each gap.
Use a flat, grippy surface. Mark start and finish lines 1 m apart, with about 20 cm of dominoes before the start, because the first few are still speeding up.
Record each run on your phone, as audio or slow-motion video, and read the time between the start-line and finish-line dominoes. A hand stopwatch is too coarse here.
Do three runs per gap and average them. Speed = 1 m ÷ time.
Divide each speed by √(gH) so you can compare with published results.
Worked example: for H = 0.05 m, √(gH) = √(9.8 × 0.05) = 0.70 m/s. At Larham's measured peak of 1.53, that is about 1.07 m/s, so your 1 m run takes about 0.93 s. At his closest, less reliable gap, 1.07 × 0.70 gives 0.75 m/s, or about 1.33 s. The whole effect of spacing is a few tenths of a second, which is why the timing method matters.
What should your speed-against-spacing graph look like?
Put gap ÷ height on the x-axis and speed ÷ √(gH) on the y-axis, as in our chart of Larham's data above. His runs suggest a climb from the smallest gaps, a flat top between about 0.2 and 0.6 and a gentle fall; van Leeuwen's model predicts a steady fall instead. Your graph can test which your dominoes follow. Near 0.87, expect runs to stall or slip. For axes, scales and a smooth curve through scattered points, see how to plot graphs in a physics practical.
If your graph differs, check for slippery dominoes, a smooth table or uneven gaps. To watch rotation and energy transfer before you build, the Fermi Simulation Lab has interactive simulations for ideas that are easier to see than to read.
Pick a gap, set up your first metre and press record.