On this page
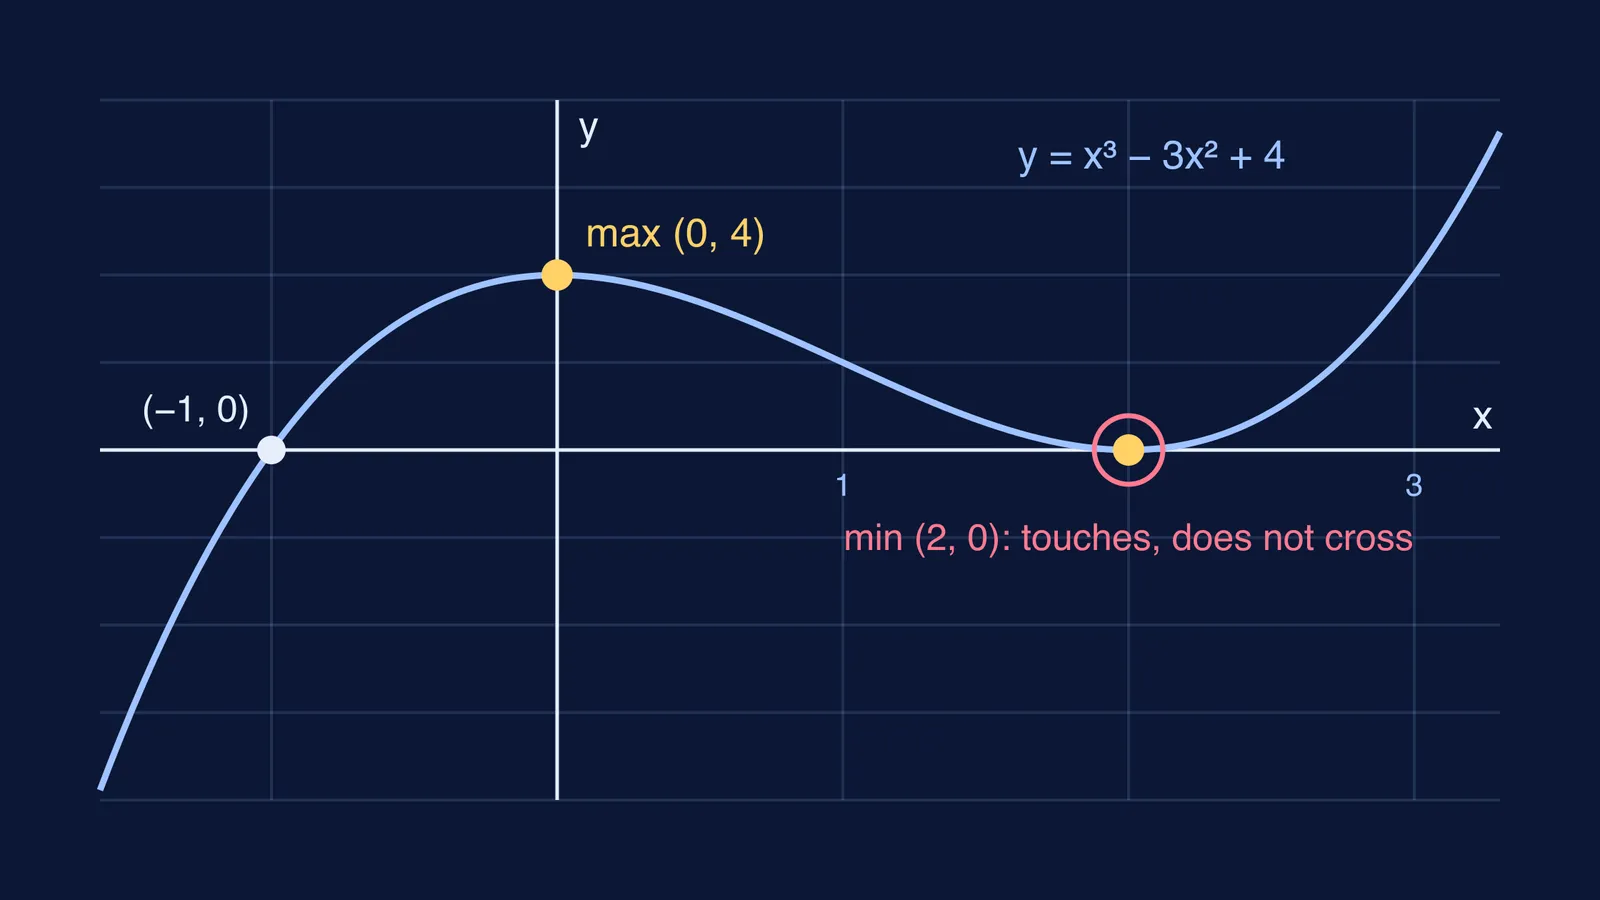
You ask an AI about f(x) = x³ − 3x² + 4. It answers with confidence: two turning points, and the curve crosses the x-axis at x = −1 and x = 2. One of those statements is wrong, and a graph shows you which.
Why check an AI's graph claims at all?
Chatbots write maths in fluent, confident sentences, and confidence is not evidence. In the GSM-Symbolic study, Iman Mirzadeh and colleagues found that adding a single clause that seems relevant, but plays no part in the reasoning, caused performance drops of up to 65% across the state-of-the-art models they tested. The same paper reports that models answer less reliably when only the numbers in a question are changed.
There is a second reason, and it is about you. In a field experiment with nearly a thousand high school maths students, Bastani and colleagues (PNAS, 2025) found that students given unrestricted GPT-4 access during practice did worse than students who never had it, once that access was taken away; a tutor version with learning safeguards largely avoided the harm. The authors write that "generative AI is fallible and users must check its outputs." Checking the graph yourself is the habit that keeps the thinking yours.
How do you check AI claims about a graph by plotting it?
Write each claim as its own testable sentence: "turning point at x = 0", "crosses the x-axis at x = 2".
Open a free graphing calculator such as Desmos or GeoGebra and type the exact function from your question, not the AI's rewritten version of it.
Click the curve. Desmos highlights points of interest such as maxima, minima, x and y intercepts and intersections; click a point to read its coordinates.
Zoom in around every claimed point. From far away, touching the axis and crossing it look the same.
Tick or cross each claim, then go back to the algebra for every one that failed.
Worked example: does it really cross at x = 2?
For f(x) = x³ − 3x² + 4, the derivative is f′(x) = 3x² − 6x = 3x(x − 2), which is zero at x = 0 and x = 2. So the AI's "two turning points" is right: f(0) = 4 is a maximum and f(2) = 0 is a minimum.
Now the crossing claim. Plot it and zoom in at x = 2: the curve comes down to the axis, touches it and goes back up. The algebra agrees, because x³ − 3x² + 4 = (x − 2)²(x + 1). A squared factor means a repeated root, and at a root of even multiplicity the graph touches the axis without changing sign. The only true crossing is at x = −1.
This matters for sign questions and inequalities: when you solve f(x) > 0, x = 2 must be left out.
What if the AI says there are two turning points?
Try y = x³ + 3x. A chatbot matching the pattern "cubic" may say it has two turning points. Plot it: the curve rises all the way across, with no hump and no dip. The derivative, 3x² + 3, is never zero, so there are no turning points at all. A cubic can have two turning points or none, or a single flat point of inflection like y = x³ at the origin, and the graph tells you which at a glance.
If the derivative step feels shaky, our guide to sketching the derivative graph from a function shows how a curve's slope becomes a graph of its own. Then try sliders in a graphing calculator: write y = x³ + ax, drag a from 3 down to −3, and watch two turning points appear as a crosses zero.
What should you do when the graph and the AI disagree?
Trust neither blindly; find the step that broke. Paste one of these back to the AI:
"You said the curve crosses at x = 2. My graph shows it touching. Factorise f(x) and give the multiplicity of each root."
"Write f′(x) and solve f′(x) = 0 step by step."
"Find the sign of f(x) just left and just right of x = 2."
Graphs have limits too. A badly chosen window can hide a turning point, and a plot cannot prove a root is exact; it only shows you where to look. Use the plot to catch the error and the algebra to explain it. The same plot-then-check habit works for complex numbers, as in checking an AI's principal argument by plotting the point.
If you keep landing on the wrong method, the Fermi Problem Library has worked problems with a step-by-step solver that explains the reasoning rather than printing an answer. And Fermi's AI tutor draws the figure as it teaches and checks your understanding as it goes, so the graph is part of the explanation, not an afterthought.
Next time an AI tells you where a curve turns or crosses, plot it before you believe it.