
On this page
Hold a necklace by its two ends and let it sag. Before you read on, predict: is that curve a parabola, like a thrown ball's path, or something else? Write your answer down, then check it with numbers you can reproduce on paper.
Is a hanging chain a parabola or a catenary?
It is a catenary, not a parabola. The MacTutor History of Mathematics archive gives its equation as y = a cosh(x/a), where cosh is the hyperbolic cosine.
Its history shows why checking matters. MacTutor credits Joachim Jungius with disproving the claim, which it links to Galileo, that a chain hanging under gravity forms a parabola. The Wikipedia account of the catenary's history adds that Jungius's proof was published in 1669, after his death, and that Galileo, in Two New Sciences (1638), described a hanging cord as only an approximate parabola. The exact equation came in 1691, when Leibniz, Huygens and Johann Bernoulli each answered a challenge set by Jacob Bernoulli, according to MacTutor. If you predicted a parabola, you are close. The useful question is how close.
Why does a chain make a catenary but a bridge cable a parabola?
The difference is in how the weight is spread. In his demonstration notes for the 2019 spring meeting of the Chesapeake Section of the American Association of Physics Teachers, Virginia Tech physicist Tatsu Takeuchi derives both shapes from the same force balance on a piece of string.
A chain carries only its own weight, so every centimetre measured along the chain carries the same load. The steep parts near the ends hold more chain per horizontal centimetre, so they carry more weight. That gives the catenary.
A heavy bridge deck hung from a light cable puts the same load on every metre measured horizontally. That gives a parabola, with height proportional to x squared.
Takeuchi notes that real suspension-bridge cables fall between the two, since they carry their own weight as well as the deck, and that the difference cannot be seen in photographs taken from afar.
How can you test it yourself?
Here is a worked example for a 90 cm chain hung from two pins 60 cm apart at the same height. The numbers are our own calculation from the formulas in Takeuchi's notes, where the length of a catenary between level supports is (2/k) sinh(kD) and D is half the gap.
Predict. Before hanging it, sketch where the lowest point will be and how steep the chain will be at the pins.
Measure. Hang the chain and measure the sag. For these numbers, the catenary sags about 30.2 cm below the pins.
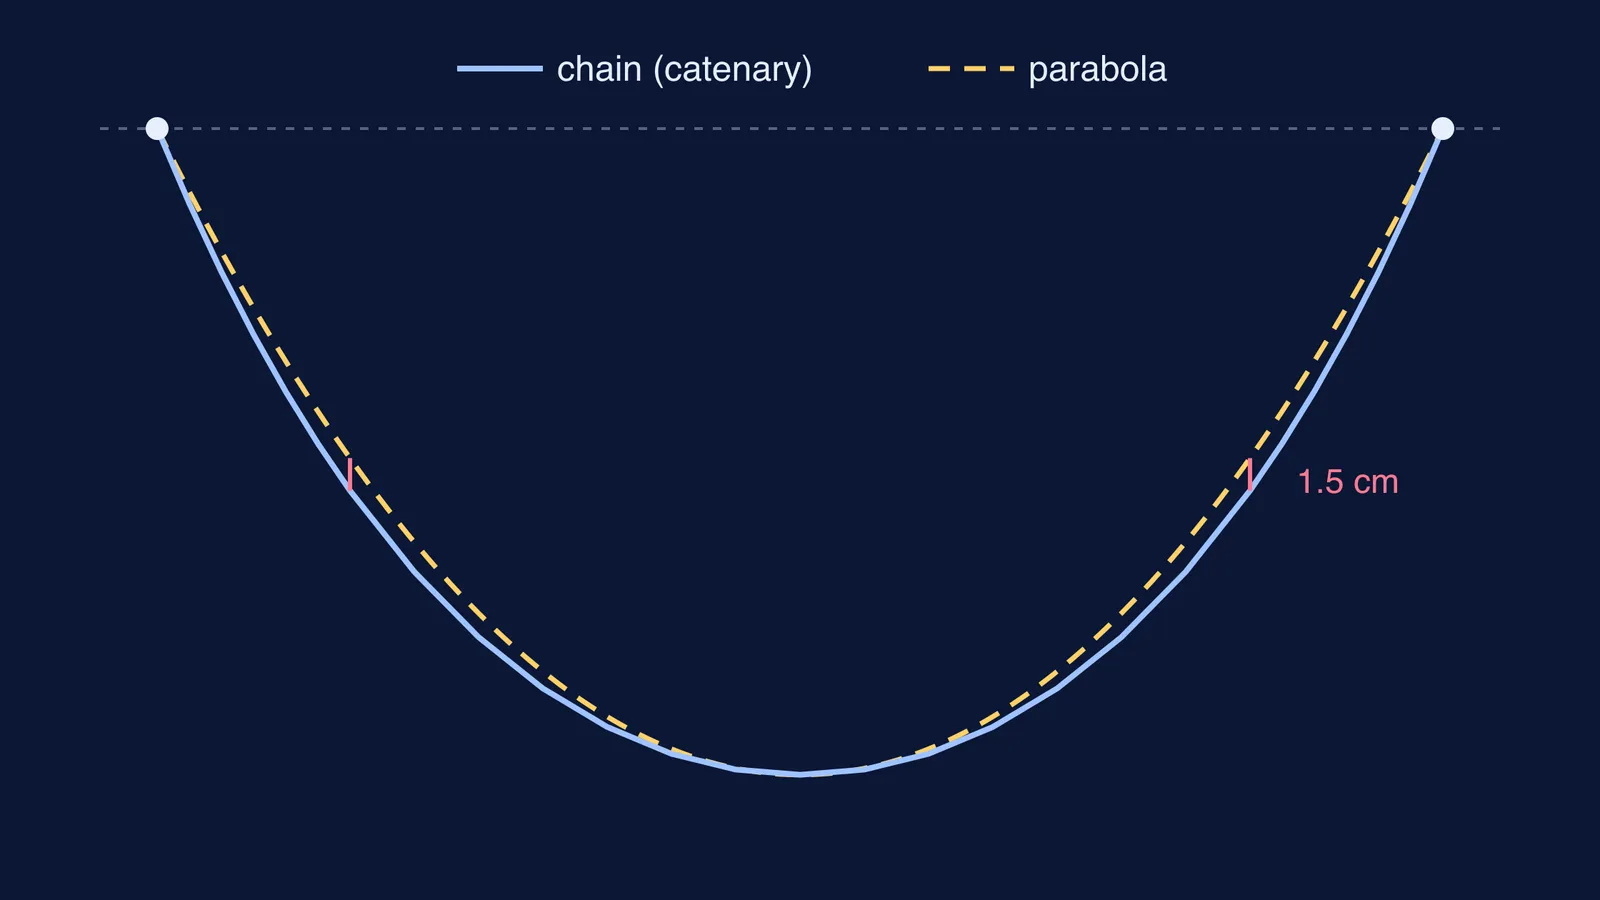
Draw the rival parabola. Draw the parabola through both pins and the lowest point. It has the same ends and the same sag, so any difference is the shape alone.
Overlay. Trace the chain on paper taped behind it, or photograph it square-on and plot both curves on top in a graphing app.
Compare at the edges. Look near the pins and at the shoulders of the curve, not at the bottom.
What you should see: in the middle, the two curves nearly coincide. Near the ends they separate. The chain leaves each pin at about 68 degrees to the horizontal, while the parabola leaves at about 64 degrees. At the widest gap, roughly 9 cm in from each pin, the chain hangs about 1.5 cm below the parabola, around one-twentieth of the sag. That is large enough to see with a ruler.
When is a parabola good enough?
Takeuchi compares catenaries with parabolas for strings from 1.1 to 3 times as long as the gap between the supports, and finds the difference hardly noticeable when the string is only slightly longer than the gap. That gives a simple rule of thumb:
Shallow sag (a tight washing line, a chain only a little longer than the gap): a parabola is a fair approximation.
Deep sag (a loose necklace, a chain much longer than the gap): use the catenary, because the parabola gets the steepness at the ends wrong.
Load spread evenly along the horizontal (an idealised suspension-bridge deck): the parabola is the correct answer, not an approximation.
For JEE Main and JEE Advanced, it is a neat test of what a formula assumes: a projectile's parabola comes from constant horizontal velocity plus constant downward acceleration; the catenary comes from weight spread along the curve. Same gravity, different bookkeeping.
What should you explore next?
If you like curves that beat intuition, read how the brachistochrone shows the fastest slide is not a straight line, and see the same cosh function turn up for a bead sliding along a smooth rotating rod. To do the overlay without a printer, sliders in a graphing calculator let you adjust a in y = a cosh(x/a) until the curve sits on your photo.
When a shape is easier to see than to read about, the Fermi Simulation Lab has interactive simulations for ideas like this one, so you can change a setting and watch what happens instead of imagining it.