On this page
Two steel bars from the same batch look identical, yet one snaps at a lower load. Waloddi Weibull's answer to that puzzle, a short formula from 1951, is still widely used to describe how strong a material is and how long a part lasts.
Who was Waloddi Weibull?
Weibull was born on 18 June 1887 in Vittskövle, Sweden, and died on 12 October 1979 in Annecy, France, according to his biography on Wikipedia. He served in the Swedish Coast Guard, rising to Major, while studying at the Royal Institute of Technology in Stockholm and at Uppsala, where he earned a doctorate in 1932, says a biography on the Random Services probability site. The same page records a research professorship in physics at the Royal Institute of Technology from 1941, consulting for firms such as SAAB and Bofors, and the ASME Gold Medal in 1972.
In 1939 he had already recognised that the weak end of the strength distribution follows a power law, as the article on the size effect in structural strength explains.
What did Weibull's 1951 paper actually say?
The paper, "A Statistical Distribution Function of Wide Applicability", appeared in the Journal of Applied Mechanics, volume 18, pages 293 to 297, in September 1951. A scan of the original paper notes it was contributed for presentation, by title, at the ASME annual meeting in Atlantic City in November 1951.
His formula gives the probability F(x) that a sample fails at or below a value x: F(x) = 1 − exp(−(x − xᵤ)ᵐ / x₀). Here xᵤ is the value below which nothing fails, and m, the shape number, sets how spread out the failures are.
He claimed no theoretical basis for it, writing that "the only merit" of the function was that it is "the simplest mathematical expression of the appropriate form", and that it "may sometimes render good service". Then he tested it on seven data sets, from fly ash particles to the heights of adult men born in the British Isles.
For 389 tests on a Bofors steel, his curve fitted with a chi-square probability of 0.49, while a normal (bell) curve scored 0.008, which he called "not satisfactory at all". For 3,000 Indian cotton fibres, taken from a 1930 study by R. S. Koshal and A. J. Turner, his three-parameter curve scored 0.35 against 0.07 for a five-parameter Pearson curve. A higher score here means a better fit.
Why does the weakest link decide the strength?
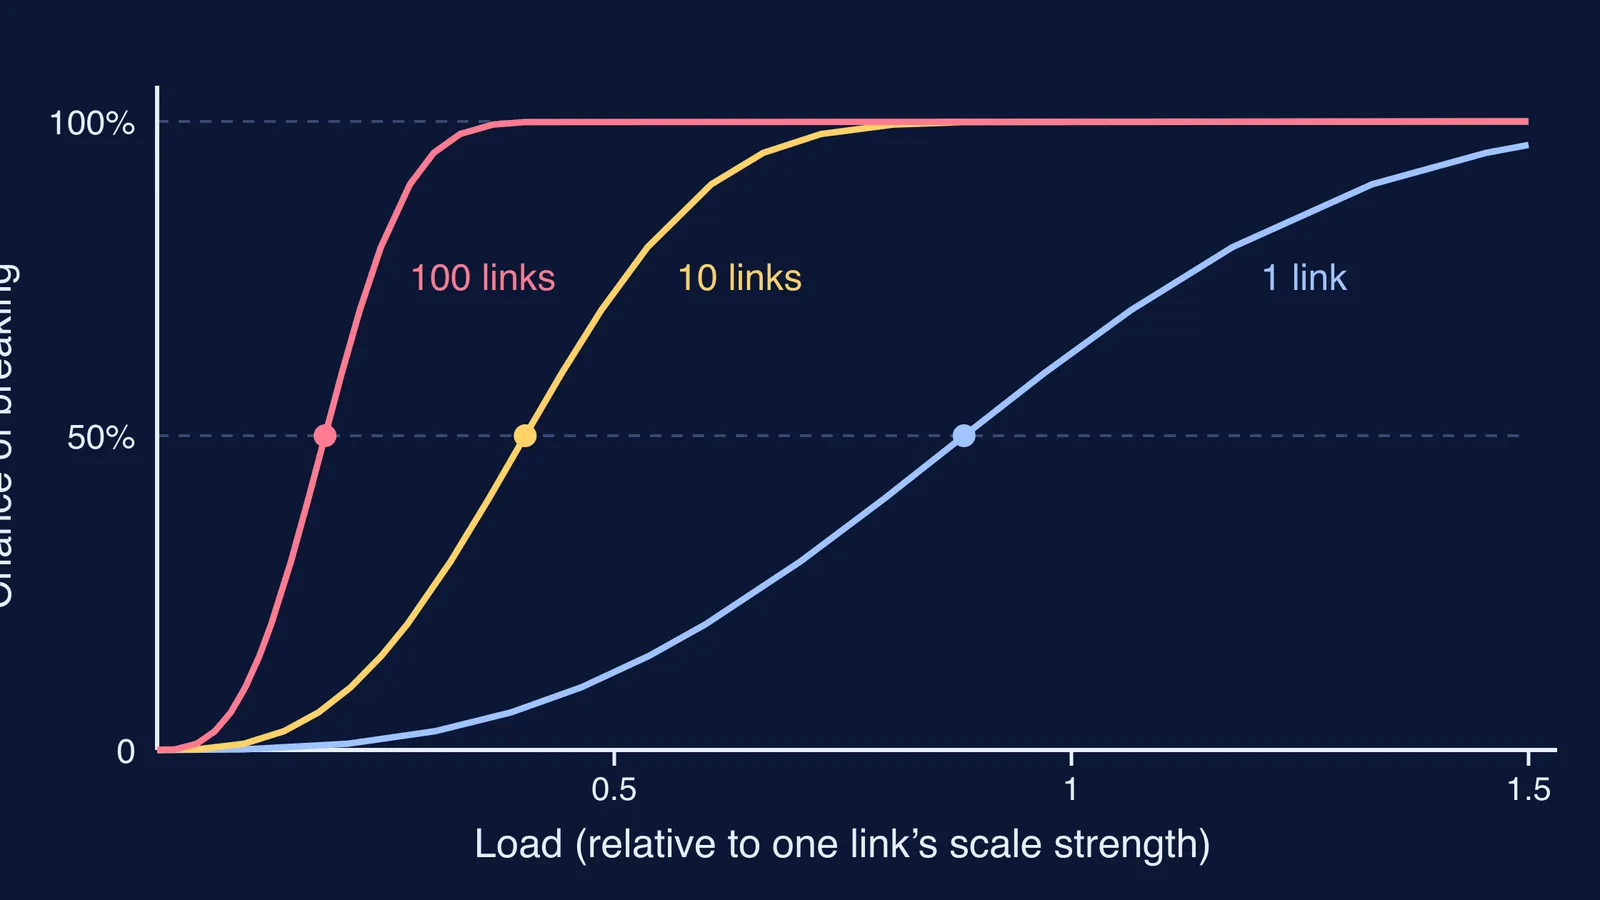
Weibull's 1951 paper sets out the idea with a chain. If one link fails with probability P under a load, a chain of n links survives only if every link survives, so (1 − Pₙ) = (1 − P)ⁿ. This is the same rule as the probability of at least one success, 1 − qⁿ, and the same logic as a series circuit that fails if any switch fails.
Worked example: suppose one link has a 1% chance of breaking at some load. A 100-link chain survives with probability 0.99¹⁰⁰ ≈ 0.366, so it breaks about 63% of the time at a load that almost never breaks a single link.
Plug Weibull's formula into the chain rule (taking xᵤ as zero) and the median breaking load of n links falls as n raised to the power −1/m. With m = 2.934, the value Weibull fitted to his Bofors steel, a 10-link chain has a median breaking load about 0.46 times that of one link, and a 100-link chain about 0.21 times. Bigger samples of the same material tend to be weaker: the statistical size effect. In real solids the weak links are tiny flaws, like the cracks that Griffith showed make glass break far below its theoretical strength.
How does the Weibull distribution model how long parts last?
The NIST Engineering Statistics Handbook writes the reliability as R(t) = exp(−(t/α)^γ) and the failure rate as h(t) = (γ/α)(t/α)^(γ−1), where α is the characteristic life and γ is the shape number. When γ = 1 the failure rate is constant and the model becomes the exponential distribution; when γ is above 1 the failure rate rises with age. The handbook notes it has been successful for capacitor, ball bearing, relay and material strength failures.
How do you solve a weakest-link problem step by step?
Ask: does any one part failing mean the whole thing fails? If yes, it is a weakest-link (series) problem.
Write the survival probability of one part, 1 − P, or exp(−(x/x₀)ᵐ) if a Weibull model is given.
Raise it to the power n for n identical, independent parts.
Subtract from 1 to get the chance the whole system fails, and sanity-check that it is larger than for one part.
If step 3 is where your working goes wrong, the Fermi Problem Library has worked problems with a step-by-step solver that explains the reasoning rather than printing an answer.
Next time you see a chain, count the links: Weibull's point is that every extra one is another chance to break.