
On this page
The story of who first measured a true black body's spectrum centres on two experimenters at the Physikalisch-Technische Reichsanstalt (PTR) in Berlin. Otto Lummer and Ernst Pringsheim heated a hollow oven, measured the infrared light leaking from it, and plotted intensity against wavelength. Physics professor Clayton Gearhart, in a review in Physics in Perspective, writes that their data from November 1899 "were the first to suggest a possible deviation from Wien's law." That small mismatch between a graph and a formula started the road to quantum physics.
Who first measured blackbody radiation experimentally?
Hot objects were measured before 1899. The Nobel committee's 1911 presentation speech for Wilhelm Wien notes that Langley, in 1886, used his spectrobolometer to map the spectrum of several heat sources. Friedrich Paschen fitted his 1896 data to a formula close to Wien's, as Himanshu Mavani and Navinder Singh describe in a 2022 history of the blackbody problem. The hard part was making a true black body. Real surfaces reflect some light, so what you measure depends on the material.
The same Nobel speech says this difficulty "was only removed in 1895, when Wien and Lummer stated the principles according to which a completely black body could be constructed". Their key point: radiation coming out of a small hole in a hollow body, with all its walls at one temperature, behaves like radiation from a perfect black body.
Lummer (1860-1925) worked mainly on optics and thermal radiation. Pringsheim (1859-1917) made the radiometer a useful instrument for measuring infrared.
What did Lummer and Pringsheim's 1899 graph show?
Gearhart's review reprints their November 1899 figure. It plots intensity against wavelength from about 1 to 6 micrometres, with one curve for each temperature from 723 up to 1646 degrees. Every point lies in the infrared, beyond the 0.7 micrometre edge of visible light. Crosses are measured values; circles are values calculated from Wien's law.
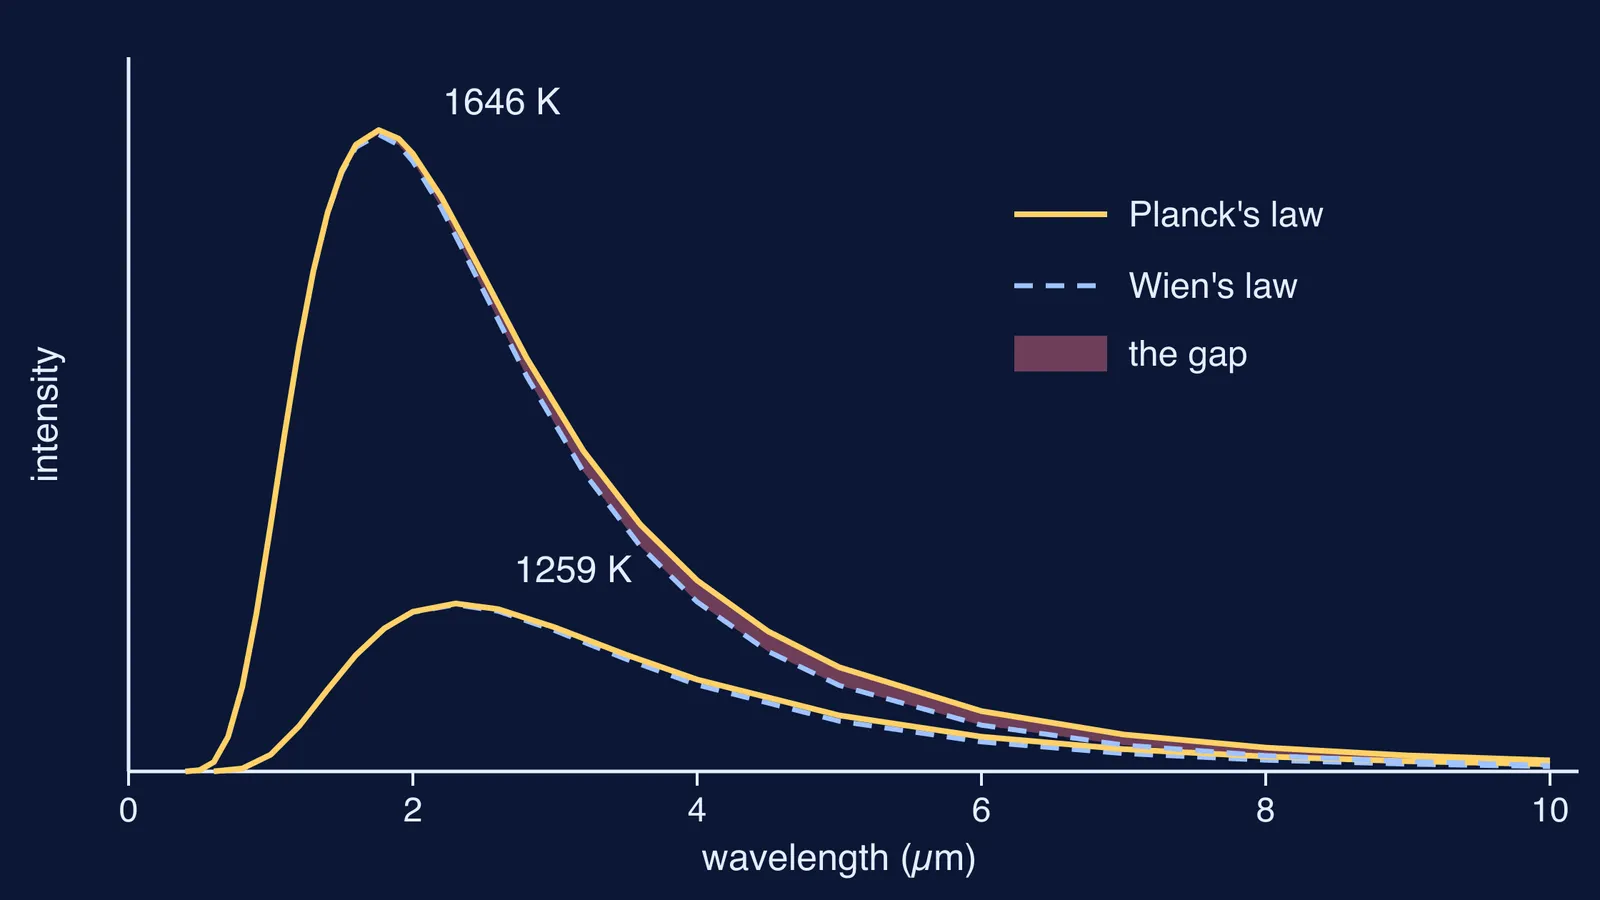
At short wavelengths the two match. Further out, the measured curve sits above Wien's. Mavani and Singh's history sums it up: in 1899 Wien's formula agreed at small wavelengths, "but at a larger wavelength and higher temperature, there is a systematic difference with experimental data." At first it could have been experimental error, Gearhart notes. By September 1900, Lummer and Pringsheim were confident enough to publish on the "invalidity of the Wien-Planck spectral equation", according to Encyclopedia.com.
How did a failed formula lead to Planck's quantum?
In 1899 Planck had derived Wien's law from thermodynamics, Gearhart explains. Then Heinrich Rubens and Ferdinand Kurlbaum, also at the PTR, pushed the measurements out to 24 micrometres, where Wien's law clearly fails. In October 1900 Planck gave the German Physical Society a new formula that fitted. In December 1900 he published a second paper that introduced energy quantization and the constant now called h, according to Mavani and Singh. Our post on Max Planck and the 1900 idea he did not fully believe continues the story.
How do you read a blackbody graph in Class 11?
Five checks for any intensity-wavelength graph:
Read the axes: wavelength across, intensity per unit wavelength up, and each curve's temperature.
Find each peak. Wien's displacement law says the peak wavelength times the temperature is a constant, b = 2.898 × 10⁻³ m K (NIST), so a hotter body peaks further left.
Compare areas. The area under each curve is the total power, which grows as T⁴, as Gearhart's review notes.
Check the shape: a steep climb on the short-wavelength side and a long, slow tail on the long side.
Check that curves never cross. A hotter body is brighter at every wavelength.
Here is a worked example using the hottest 1899 curve, at 1646 K. The peak is at b/T = 2.898 × 10⁻³ / 1646 ≈ 1.76 micrometres. For the 1259 K curve, the peak moves to about 2.30 micrometres. The total power ratio is (1646/1259)⁴ ≈ 2.9, so the hotter cavity radiates almost three times as much.
Now the gap itself. Wien's law divided by Planck's law equals 1 − e^(−c₂/λT), where c₂ = 1.4388 × 10⁻² m K (NIST). At 1646 K and 2 micrometres this ratio is about 0.987, so Wien is only 1.3% low. At 6 micrometres it is about 0.77, so Wien is 23% low. That is the 1899 pattern: fine near the peak, wrong in the tail.
If b and the T⁴ rule still feel like formulas rather than ideas, the Fermi Concept Library gives each concept its own lesson. To practise, try our Stefan's law and Wien's law problems, or the Fermi Problem Library, where a step-by-step solver explains the reasoning rather than printing an answer. For the theory behind the peak shift, read who discovered Wien's displacement law.
Next time you sketch a blackbody curve, draw the long tail carefully.