On this page
Every time you read that a result is "statistically significant", someone has asked a simple question: could this pattern be luck? One of the first people to ask it with numbers was John Arbuthnot, a London doctor, mathematician and writer who was physician to Queen Anne (Wikipedia). His data were baptism records. His tool was a coin.
What did John Arbuthnot find in London's birth records?
Arbuthnot's paper, An Argument for Divine Providence, taken from the Constant Regularity observ'd in the Births of both Sexes, appeared in the Royal Society's Philosophical Transactions in 1710. It printed a table of children christened in London, boys and girls counted separately, for each year from 1629 to 1710.
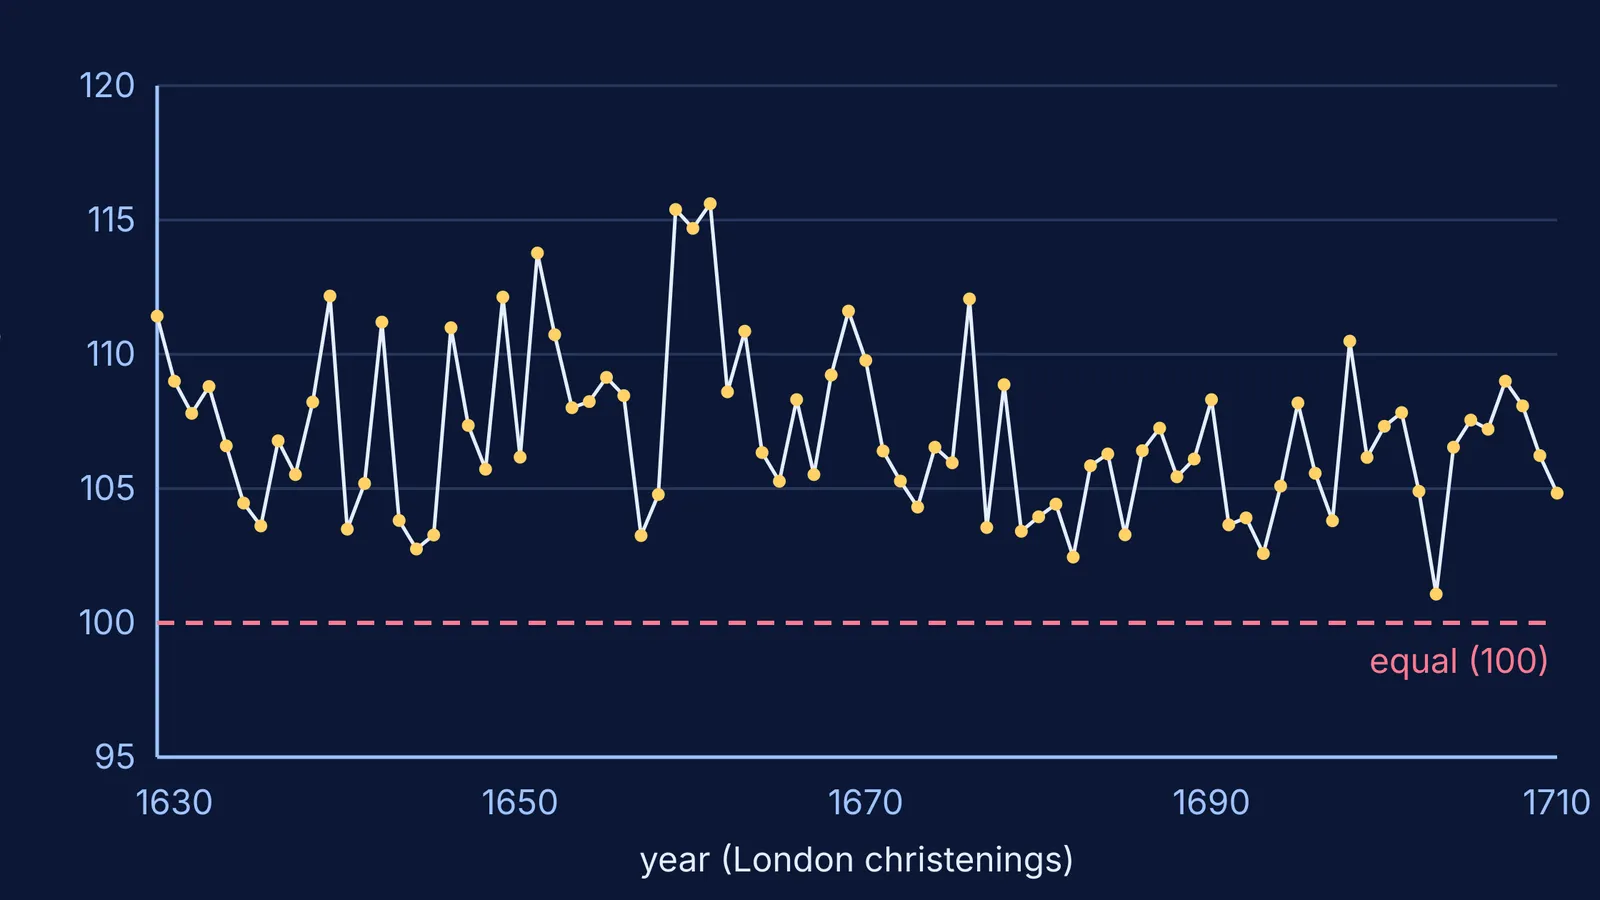
In all 82 years of the table, more boys than girls were christened (transcription of the 1710 paper). The closest year was 1703, with 7,765 boys and 7,683 girls. The biggest lead in proportion was in 1661, with 4,748 boys and 4,107 girls.
Arbuthnot also offered a reason. He believed boys later faced more "external Accidents", so that "provident Nature, by the Disposal of its wise Creator, brings forth more Males than Females". For an earlier story of people counting London's parish records, read how John Graunt turned London's death lists into statistics.
Why is Arbuthnot's argument called the first significance test?
A significance test asks how likely your data would be if nothing but chance were at work. The p-value is the probability of a result at least as extreme as the one you observed, assuming the chance model (the null hypothesis) is true (Wikipedia: p-value).
Arbuthnot set it up as a bet. In his words: "A lays against B. that every Year there shall be born more Males than Females: To find A's Lot" (the 1710 paper). He gave each year a chance of 1/2 of having more boys, like a fair coin, "that the Argument might be stronger". For 82 years in a row, the chance is (1/2)^82. He found it far too small to believe and wrote: "it is Art, not Chance, that governs."
The paper is widely credited as the first use of significance tests and perhaps the first published report of a nonparametric test (Wikipedia). Today his method is called a sign test: you count only which side wins (plus or minus), not by how much.
How do you redo Arbuthnot's calculation yourself?
You need only Class 11 probability. Here is the same test, step by step.
The chance model (the null hypothesis): each year is a fair coin toss. Boys win with probability 1/2, girls win with probability 1/2.
The data: boys won in 82 out of 82 years.
The p-value: the chance of 82 wins in 82 tosses is (1/2)^82 = 1 / 4,835,703,278,458,516,698,824,704, which is about 2 × 10^-25.
A sense of scale: 10 boy-years in a row already has a chance of 1/1,024. Twenty in a row is about one in a million (1/1,048,576).
The decision: a result this unlikely under the coin model means the coin model is wrong.
A modern statistician would make one change. Girls winning every year would have been just as surprising, so a two-sided test doubles the p-value to (1/2)^81. That is still about 4 × 10^-25, and the conclusion does not move.
If you want to see how coin-toss counts spread out before you trust the formula, our post on the binomial distribution simulation and predicting the coin-toss histogram walks through it. The Fermi Simulation Lab has interactive simulations for ideas like this that are easier to see than to read.
What did Arbuthnot get wrong?
His maths was right; his conclusion went further than the data.
Rejecting chance does not prove your explanation. The data rule out a 50:50 coin. They do not show design. The simplest alternative is that a birth is a little more likely to be a boy.
That simple alternative fits. In most countries there are around 105 boys per 100 girls at birth, which the WHO treats as the expected sex ratio at birth, with a normal range of about 103 to 107 (Our World in Data). Arbuthnot's London years ranged from about 101 to 116 boys per 100 girls, as the hero chart shows.
Christenings are not births. His table counts only children who were christened, so it measures births through a filter.
He stretched the result. The paper ends by arguing that polygamy is "contrary to the Law of Nature", a moral claim no birth table can test.
The same reasoning is used in India today, in the other direction. Our World in Data notes that India's ratio has been skewed beyond the expected range, a pattern it links to sex-selective abortion and son preference.
If the step from (1/2)^82 to general binomial questions feels shaky, the Fermi Problem Library has worked problems with a step-by-step solver that explains the reasoning rather than printing an answer.
For a different way to reason from data back to causes, read about Thomas Bayes's 1763 essay on the doctrine of chances.