On this page
In 1662 a London draper named John Graunt published a short book with a long title: *Natural and Political Observations Made upon the Bills of Mortality*. He was largely self-educated, but he had printed death lists and the idea that careful counting could show what nobody had noticed. That idea is one starting point for the statistics you now study in Class 10 and for JEE.
What were London's Bills of Mortality?
The Bills of Mortality were weekly printed counts of burials in London, parish by parish. According to the Folger Shakespeare Library's history of the bills, in 1555 the city granted its Parish Clerks formal payment for continuous, weekly, parish-by-parish reports of who had died and of what.
The causes of death came from "searchers". By 1592, the same Folger article explains, London had appointed at least two women in each parish, sworn to inspect every new corpse. Later bills also counted christenings, split into male and female.
Many Londoners read the bills to see whether plague was rising. Graunt read them as data.
How did John Graunt turn death lists into statistics?
A 2022 biography in the *Journal of Medical Biography* by Henry Connor reports that Graunt worked mainly from the annual figures for 1604 to 1660, leaving out 1636 to 1647. Connor quotes Graunt's own description of the job: he "reduced several great confused Volumes into a few perspicuous Tables".
Once the numbers sat in tables, steady patterns appeared. Connor's paper records that Graunt found about 14 males to every 13 females in London, at both birth and death, and about 15 to 14 in country districts. He told acute diseases, which were often epidemic, apart from chronic ones, documented the extra deaths in epidemic years, and compared London with rural data to show that the city was less healthy.
Single deaths are unpredictable; thousands of burials settle into regular ratios.
What did Graunt's life table show?
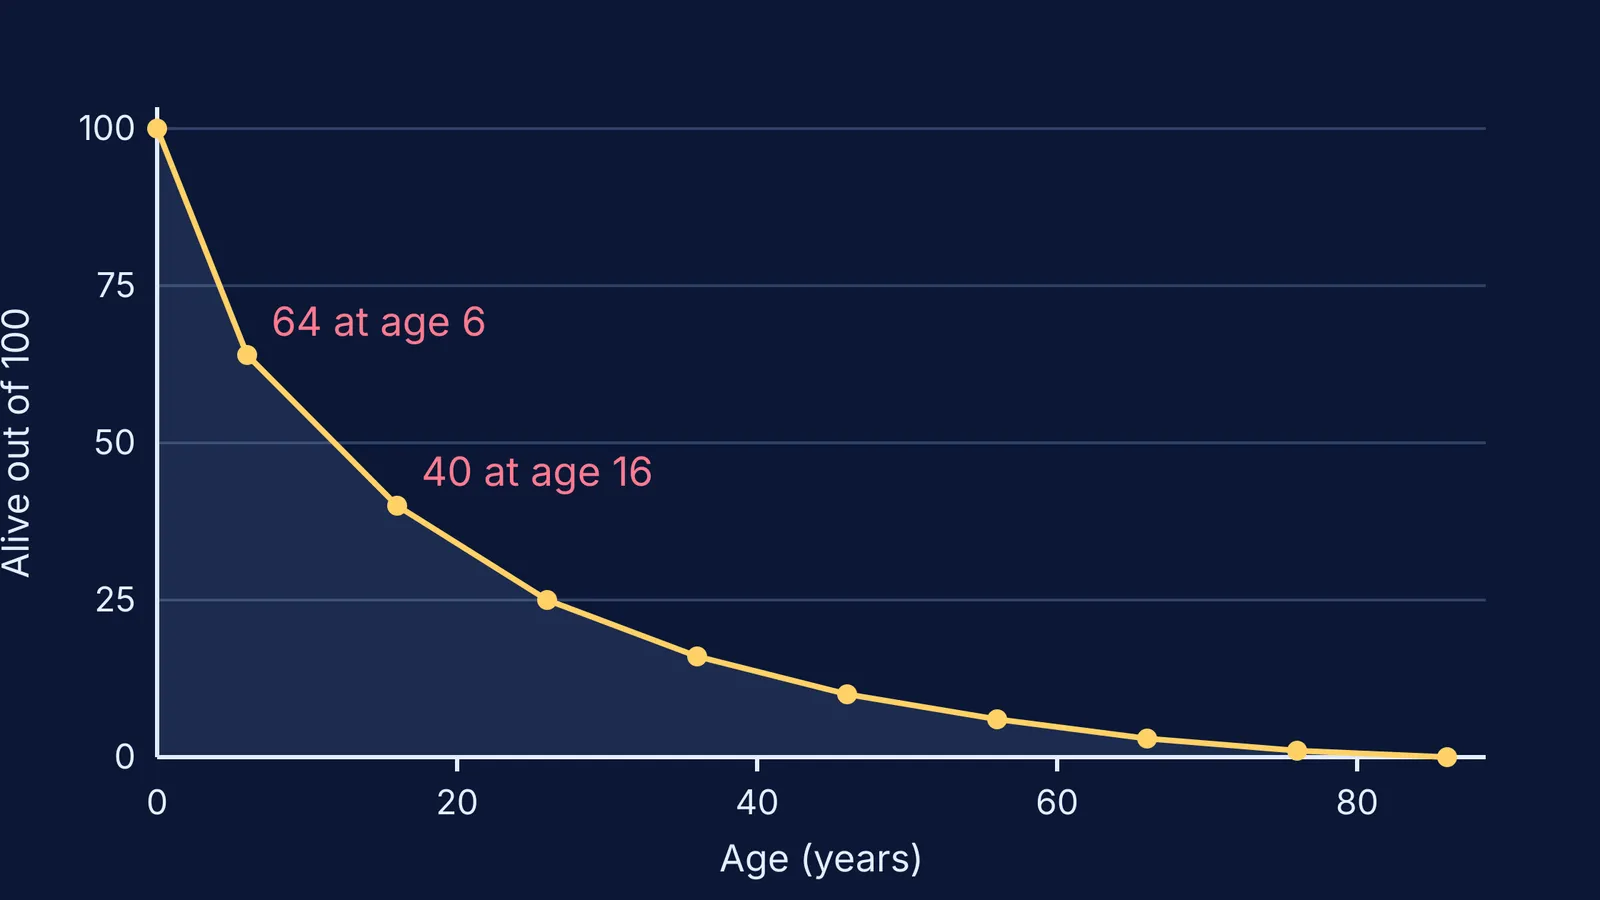
Graunt asked a new question: out of 100 children, how many are still alive at each age? His answer, reproduced from chapter XI of the *Observations* on Richard Pulskamp's history-of-probability page, was this:
Alive at 6 years: 64
At 16: 40
At 26: 25
At 36: 16
At 46: 10
At 56: 6
At 66: 3
At 76: 1
At 86: 0
In Graunt's words, "of 100 quick Conceptions about 36 of them die before they be six years old" (Pulskamp's extract). The bills did not record age at death, so no row is a direct count. Graunt estimated deaths before six and survival past 76 from the causes listed, then filled in the ages between. Even so, it was an early life table built from public records.
Try it yourself: read Graunt's table like a statistician
You can analyse Graunt's table with Class 10 maths and a pencil.
Deaths in each band. Subtract neighbouring rows. Between 6 and 16, 64 minus 40 gives 24 deaths out of the original 100.
Chance of surviving a decade. Divide neighbouring rows. From 6 to 16 it is 40/64 = 0.625. From 16 to 26 it is 25/40 = 0.625. From 26 to 36 it is 16/25 = 0.64.
Spot the pattern. After age six, roughly five in eight survive each ten-year band. That is no accident: Graunt himself says he "sought six mean proportional numbers" between 64 at age six and 1 at 76, so the ratio was built in. Always ask where a table's numbers came from.
Find a median. Half of the 100 have died somewhere between ages 6 and 16, because the count drops from 64 to 40 across that band.
Ask what is missing. Causes of death came from searchers' inspections, and ages at death were not recorded at all. How could each gap skew the numbers?
If steps 2 and 4 feel shaky, revise ratio and the median of grouped data first. Our guide to mean, median and mode of grouped data in Class 10 statistics walks through them, and the Fermi Concept Library gives each concept in mathematics its own lesson, so you can fill one gap without restarting a whole chapter.
Why is Graunt called the father of statistics?
Pulskamp's page notes that Karl Pearson called Graunt the first statistician and the first statistician to become a fellow of the Royal Society. Connor dates his election to 26 February 1662. Pulskamp also cites Thomas Sprat's 1667 history of the Society: although Graunt was a shopkeeper, King Charles II himself recommended him. The editor's note in a 1949 edition of John Aubrey's Brief Lives adds that the King told the Society to admit "any more such tradesmen" they found.
The same habit of mind runs through later public-health detectives such as John Snow and his cholera map and Florence Nightingale's statistics on army deaths: each took routine records and asked what the totals meant.
When statistics feels like formulas for their own sake, open Graunt's table and do the five steps above.