On this page
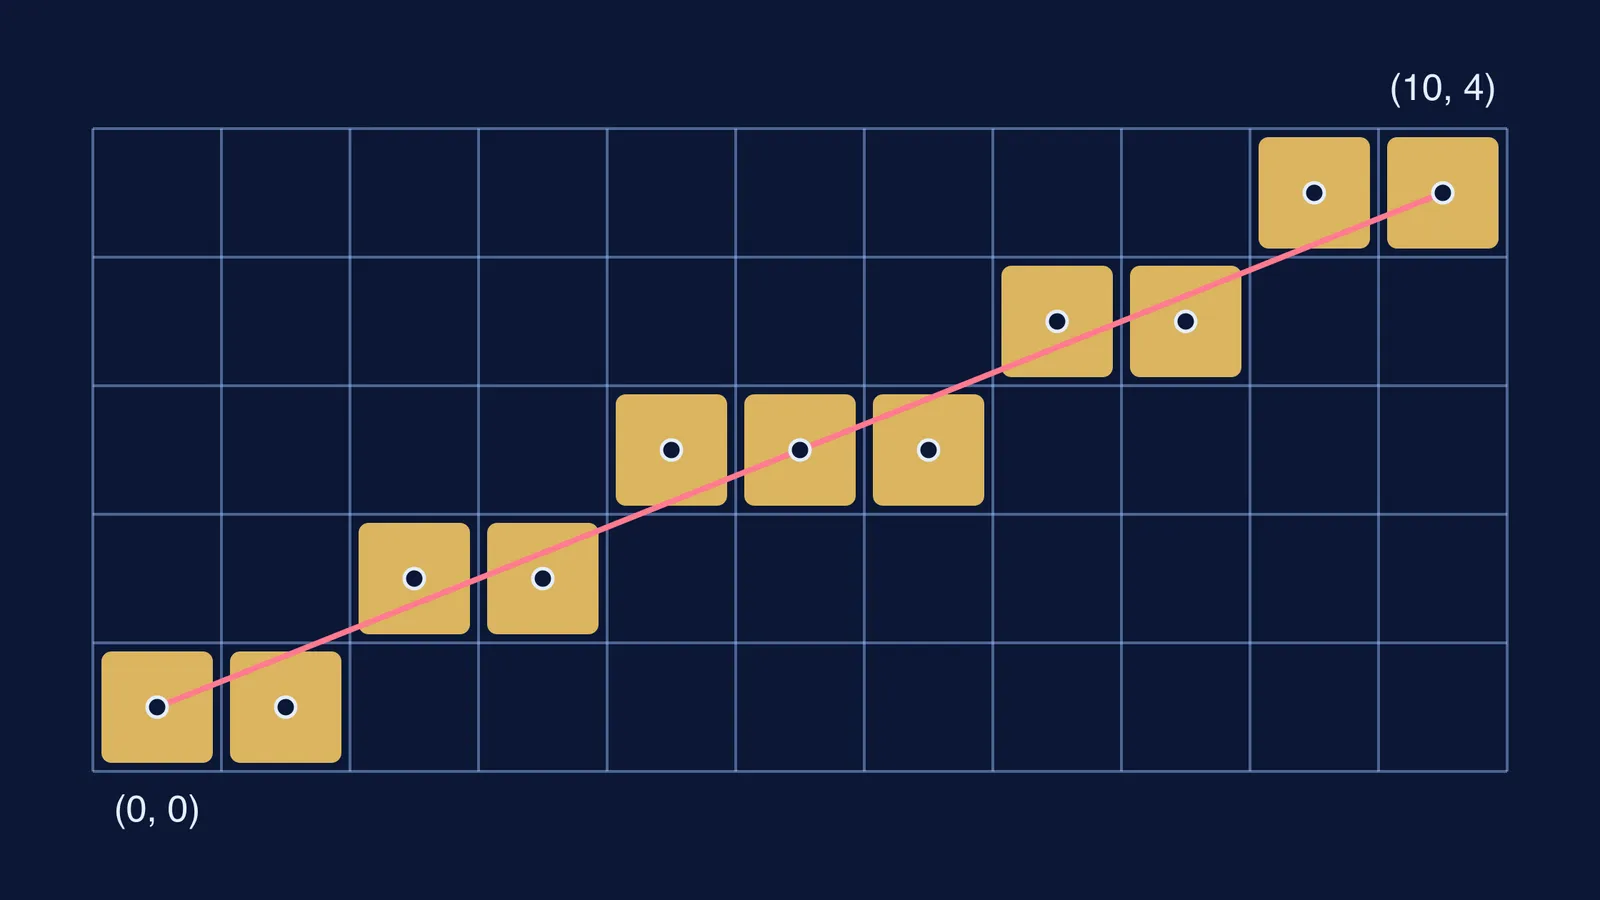
A screen is a grid of square pixels, and a true line from (0, 0) to (10, 4) passes between most of them. Something has to decide which squares to colour. A classic answer, still widely taught, comes from Jack Bresenham, who worked it out for a pen plotter at IBM in 1962.
Who was Jack Bresenham?
Jack Elton Bresenham was born in 1937 in Clovis, New Mexico, and joined IBM in 1960, according to the IT History Society. He earned a PhD at Stanford in 1964, retired from IBM in 1987 after 27 years, then taught computer science at Winthrop University for 16 years.
In a 2022 email reproduced on the IBM 1401 restoration site, he recalled "my time working in Dr. Eugene Lindstrom's comp lab at IBM San Jose from 1962-1967".
What problem did the 1962 algorithm solve?
The lab had attached a Calcomp plotter to an IBM 1401 computer through a 1407 typewriter console, as Wikipedia's history of the algorithm records from Bresenham's own account. The IBM 1401 site identifies it as a Calcomp 565 drum plotter, and quotes Bresenham saying the 1401 program plotted curves from engineering calculations.
A plotter like this moves its pen in fixed small steps: across, up, or both at once. A slanted line has to be a staircase of small moves, and the computer must choose the staircase that hugs the true line.
The algorithm was in production use by summer 1962. Bresenham presented it at the 1963 ACM national convention in Denver, as Wikipedia's history records. He published it as "Algorithm for computer control of a digital plotter" in the IBM Systems Journal, volume 4, issue 1, pages 25-30, in 1965.
How does Bresenham's line algorithm work?
The NIST Dictionary of Algorithms and Data Structures defines it in one line: "An efficient algorithm to render a line with pixels. The long dimension is incremented for each pixel, and the fractional slope is accumulated."
In plain words: step along x every time, and keep a running count of how far the true line has drifted above your current row. When the drift passes halfway, step up a row too.
The clever part is that the drift is kept as a whole number: multiply everything by 2 times the run and the fractions disappear. The algorithm then needs only addition, subtraction and bit shifts, as Wikipedia's article notes, which spares a slow machine from dividing or rounding decimals.
Worked example: drawing a line from (0, 0) to (10, 4)
This is the line in the picture above. Its run is dx = 10 and its rise is dy = 4, so the slope is 0.4. Set up three whole numbers:
Start value: D = 2dy - dx = 8 - 10 = -2
If you stay on the same row: add 2dy = 8
If you also step up: add 2dy - 2dx = 8 - 20 = -12
At each x, plot the pixel. Then, if D is greater than 0, move the next pixel up a row and add -12; otherwise add 8.
x = 0: plot (0, 0). D = -2, stay. D becomes 6.
x = 1: plot (1, 0). D = 6, step up. D becomes -6.
x = 2: plot (2, 1). D = -6, stay. D becomes 2.
x = 3: plot (3, 1). D = 2, step up. D becomes -10.
x = 4: plot (4, 2). D = -10, stay. D becomes -2.
Carry on the same way: the pixels are (5, 2), (6, 2), (7, 3), (8, 3), (9, 4) and (10, 4).
Now check it with school coordinate geometry. The true line is y = 0.4x, so at x = 1, 2, 3, 4 it sits at 0.4, 0.8, 1.2 and 1.6. Rounded, those are 0, 1, 1 and 2, the rows the algorithm chose without a single decimal. Need a refresher? See our guide to the slope of a line through two points.
How can you try it yourself?
A short exercise for a Class 11 student, or a parent and child together:
Draw a 13 by 6 grid on squared paper.
Pick an end point with a slope under 1, such as (12, 5).
Work out D, the stay amount and the step-up amount.
Shade one square per column, writing each D value beside it.
Draw the true line with a ruler and check every shaded square sits next to it.
If you code, write the loop in Python and compare.
If the equation of a line is the shaky part, the Fermi Concept Library has a lesson for every concept in mathematics and computing. If you get stuck mid-problem, the Fermi Problem Library has a step-by-step solver that explains the reasoning rather than printing an answer.
For more early graphics, read about Ivan Sutherland's 1963 Sketchpad and Pierre Bézier, the Renault engineer behind digital curves.