On this page
Every letter you type on a modern screen, and every vector graphic you see, is drawn using a mathematical trick invented to design car bodies.
Before the computer age, drafting smooth, complex curves meant using physical "splines"—flexible strips of wood or metal bent around pegs on a drawing board. But a physical spline is hard to pass from a designer to a milling machine with perfect accuracy.
In the mid-20th century, the French automotive industry needed a better way. The solution was the Bézier curve, a mathematical tool that allowed a computer to store and scale shapes flawlessly.
Who invented Bézier curves?
The history of the Bézier curve is a story of two rival car makers and a clash over corporate secrecy.
The underlying mathematics relies on Bernstein polynomials, published in 1912 by the Russian mathematician Sergei Bernstein (Source). However, these polynomials were not applied to graphics until decades later.
Paul de Casteljau developed his algorithm to calculate these curves in 1959 while working at Citroën (Source). He created a stable, step-by-step way to draw them. But Citroën treated his invention as a strict trade secret, forbidding him from publishing his research.
Pierre Bézier discovered a similar mathematical approach independently in the early 1960s while working at Renault (Source). Bézier wanted a way for car designers to define surfaces by simply moving "control handles" on a computer, feeding exact coordinates to numerical control milling machines.
Unlike Citroën, Renault allowed Bézier to publish his findings. He introduced the UNISURF computer-aided design system in 1968, and it was in full use at Renault by 1975. Because he published first and championed its practical use, the mathematical curves were named after him, while the specific method of drawing them keeps de Casteljau's name.
How does a Bézier curve work?
A Bézier curve is a parametric function whose x and y coordinates are defined by a separate variable *t* that runs from 0 to 1 (Source).
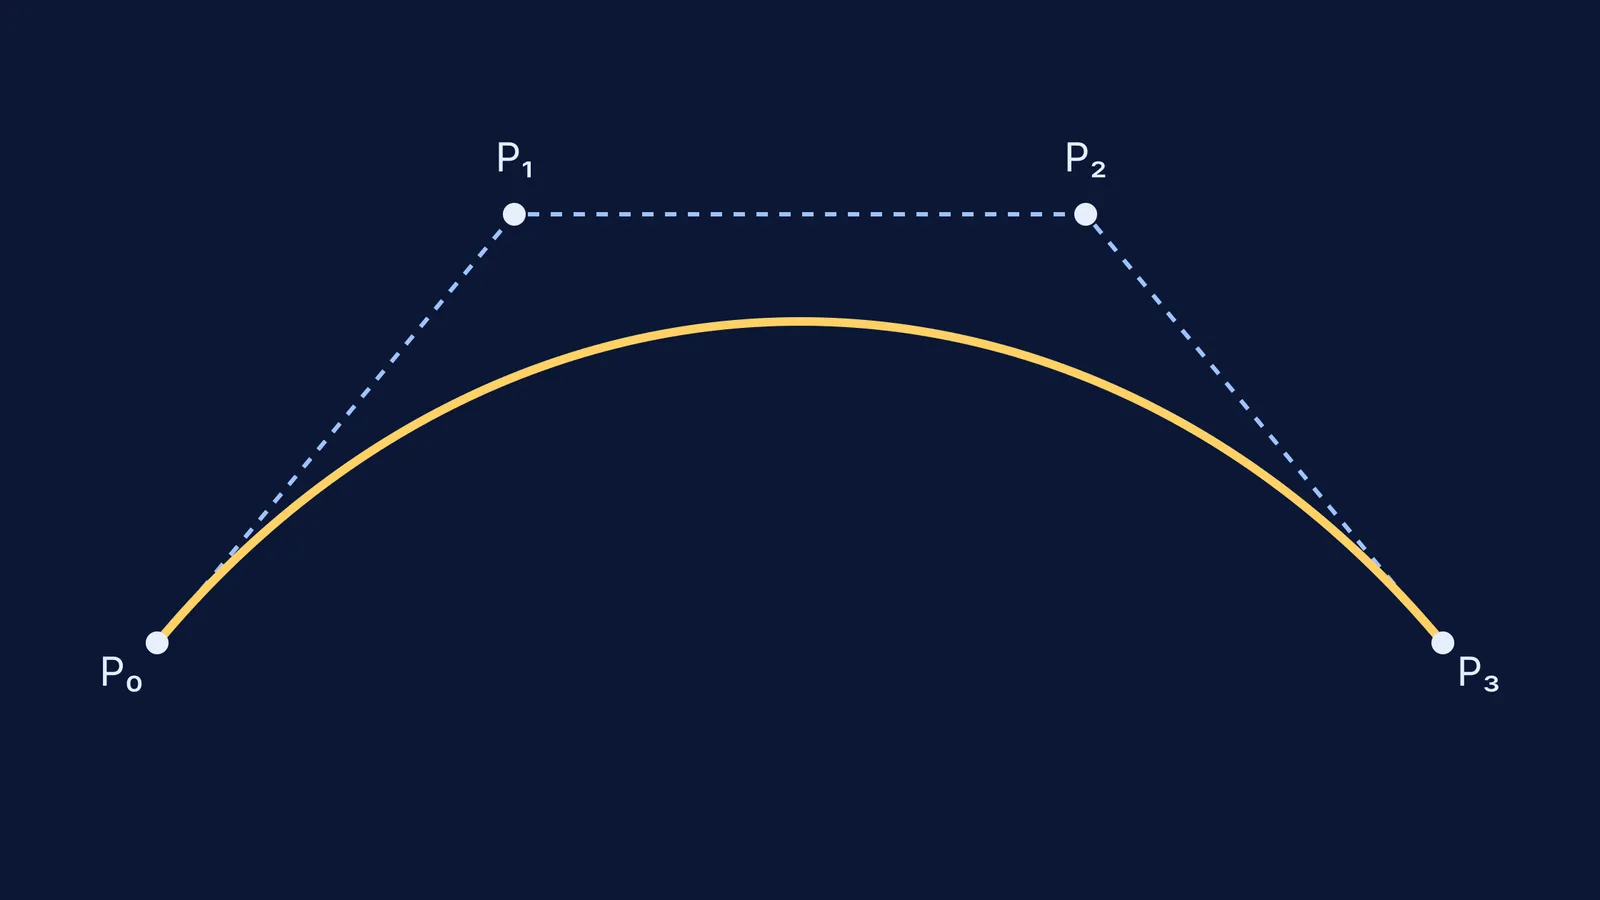
Instead of a complex equation spanning the whole screen, a cubic Bézier curve uses just four control points:
P₀: The starting point.
P₁: A control point that sets the direction the curve leaves the start.
P₂: A control point that sets the direction the curve approaches the end.
P₃: The finishing point.
The curve anchors strictly at P₀ and P₃. The two middle points, P₁ and P₂, act like magnets pulling the path toward themselves.
If you are trying to picture how moving these control points alters the final shape, you can test a cubic model in the Fermi Simulation Lab. Interactive simulations are built for ideas like this that are easier to see than to read.
How did Bézier curves reach computer graphics?
The UNISURF system proved that complex, real-world objects could be modeled in a computer using a few intuitive control handles. Just as William Playfair transformed statistics by inventing the bar chart to show numbers visually, Bézier transformed manufacturing by turning visual shapes into pure numbers.
In the 1980s, Bézier curves leaped from heavy industry into digital typography and graphic design. Adobe adopted them as the foundation of the PostScript language. Today, almost every digital font and vector graphics program relies on Bézier curves to keep edges perfectly smooth, no matter how much you zoom in.
What began as a way to cut steel for a Renault door now shapes the words you are reading right now.