
On this page
In 1882 the French physiologist Étienne-Jules Marey pointed a camera shaped like a hunting rifle at a flying gull. In one second it took twelve photographs. Laid side by side, they showed what the naked eye could not: how a bird's wings move through each beat. Here is how it worked, and how to use the same idea with a phone.
What was Marey's photographic gun?
Marey was a professor at the Collège de France who studied how living bodies move, and he had already invented the sphygmograph, an instrument that recorded the pulse as a graph, according to the Science Museum Group.
In his own 1882 article in the magazine La Nature, Le Fusil photographique, Marey wrote that he had built, at the size of a hunting gun, a device that photographed twelve times per second. Each image needed an exposure of only 1/720 of a second. Inside, a circular or octagonal glass plate turned in jerks behind the lens, so every shot landed on a fresh patch of the plate.
The chronophotographic gun drew on astronomer Jules Janssen's 1874 photographic revolver. Eadweard Muybridge had shot motion sequences with a row of separate cameras, but his bird pictures did not give Marey what he needed.
How did the photographic gun capture birds in flight?
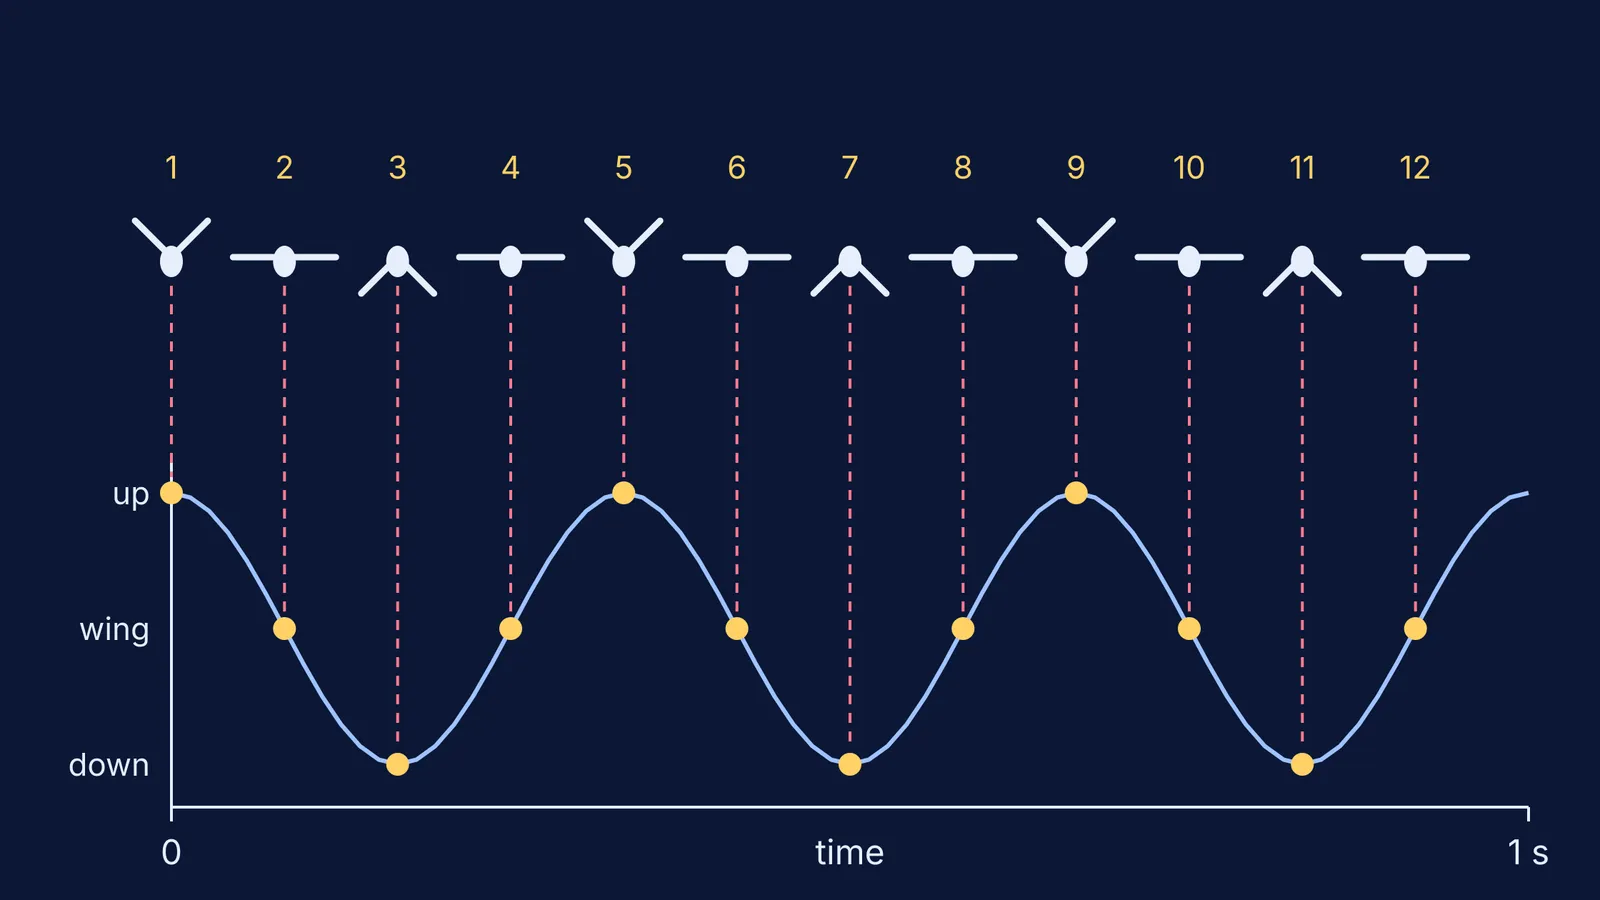
The key fact is in Marey's 1882 report: the gull beat its wings exactly three times a second, so his twelve pictures contained four wing positions that repeated with each beat. You can check why with four lines of arithmetic.
Time between frames: 1 ÷ 12 s, about 0.083 s.
Time for one wingbeat: 1 ÷ 3 s, about 0.33 s.
Frames per wingbeat: 12 ÷ 3 = 4, so each beat is sampled at four points, as in the diagram above.
Fraction of the time the shutter was open: (1/720) ÷ (1/12) = 12/720 = 1/60.
That last line is why the pictures worked: the bird moved about 60 times farther between pictures than during any one picture, so each frame could stay sharp while the sequence still showed change.
Now change the bird. At six beats a second, 12 frames give only two positions per beat. At twelve beats a second, every photo catches the same point in the beat and the wing looks frozen. This is the stroboscopic effect that can make a fan look still, or backwards, on video.
Marey also played his images back. He wrote in the same article that putting the bird photographs on a phenakistiscope, a spinning-disc toy, reproduced the appearance of flight: still frames turned back into motion, as cinema would do.
How did chronophotography lead to motion pictures?
Marey's Station Physiologique in Paris opened in 1882, and he made increasing use of chronophotography there, according to the Science Museum Group record of his pigeon chronophotograph. The same record says he gathered thousands of glass plates and nearly 800 short chronophotographic films over his career, many reproduced in his 1894 book Le Mouvement.
His fixed-plate camera of about 1882 recorded a whole sequence on one plate, with subjects against a black background, sometimes in black outfits with white or reflective lines along the limbs; the Science Museum Group says this method anticipated the motion capture used in films today.
Marey later replaced the glass plate with a strip of light-sensitive paper film that moved inside the camera, and Wikipedia calls the photographic gun one of the ancestors of the movie camera. For what came next, read how the Lumière brothers' cinematograph and first film show worked.
How can you study motion the way Marey did?
A phone's slow-motion mode works like a photographic gun. Use Marey's method on anything that repeats: a pendulum, a skipping rope, a ceiling fan at low speed, a bird at a feeder.
Count cycles: count full swings or beats for 10 seconds and divide by 10.
Find your frame rate in the camera's slow-motion settings.
Divide frame rate by cycles per second. Aim for at least 4 frames per cycle, as Marey had.
If you get 2 or fewer, the motion can look frozen or backwards; slow the object down or raise the frame rate.
Step through the clip frame by frame and mark the object's position on squared paper.
Plot position against frame number; divide frame numbers by the frame rate to get seconds.
That gives you a position-time graph from real data, the kind you use to derive the equations of motion by the graphical method in Class 9. For ready-made ideas, try these slow-motion video experiments where you predict first.
For more ideas that are easier to see than to read, the Fermi Simulation Lab has interactive simulations. If motion graphs are where you get stuck, Fermi's AI tutor can work out what you already know and build a plan for the session.
This week, film one repeating motion and count frames per cycle before you watch: that number tells you what the camera can show.