On this page
What did Auguste Piccard do in 1931?
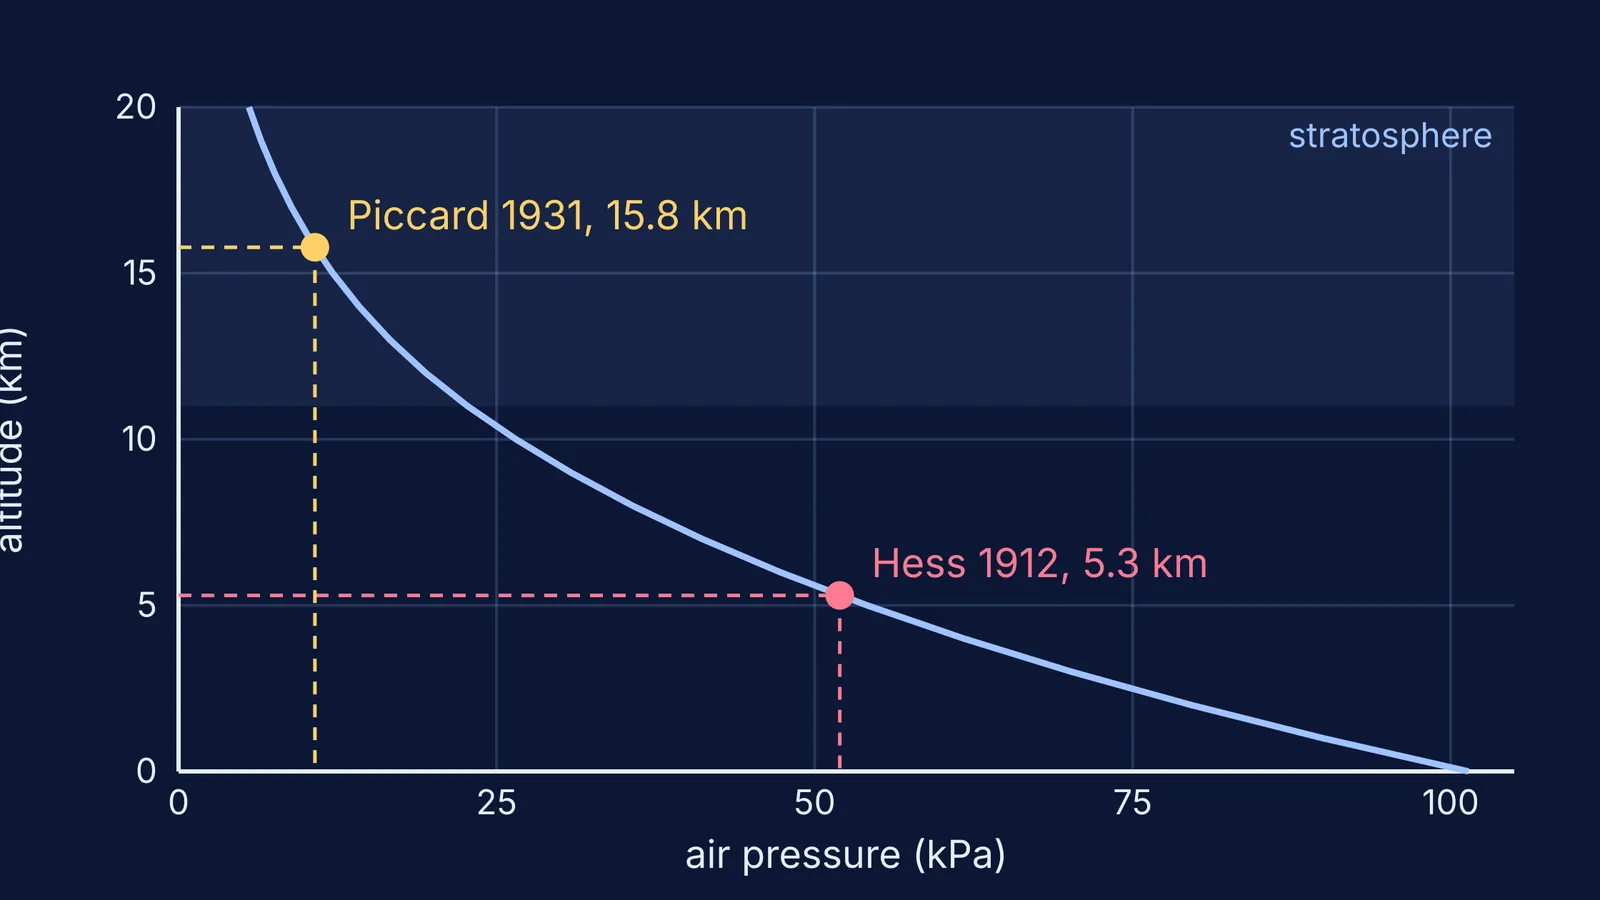
On 27 May 1931, Auguste Piccard and Paul Kipfer lifted off from Augsburg, Germany, and rose to a record altitude of 15,781 metres, according to This Day in Aviation. Some accounts give 15,785 m; either way, it is about 15.8 km. They rode not in an open basket but in a spherical, pressurised aluminium gondola that Piccard had designed.
Little went to plan. The EBSCO account of the flight says the balloon launched unexpectedly at 3:57 a.m., a broken seal caused a leak minutes later, and a problem with the gas exhaust valve, a key part of their height control, left them waiting for sundown to come down. Around 9 p.m. they landed on a glacier in the Tyrolean Alps, the Großer Gurgler Ferner near Obergurgl.
A year later, on 18 August 1932, Piccard and Max Cosyns went higher still, to 16,201 metres from Dübendorf, Switzerland, in a gondola 7 feet across with seven portholes.
Why did Piccard need a pressurised gondola?
Air pressure is the weight of the air above you pressing on each square metre, so it falls as you climb. NASA's Earth atmosphere model gives a formula for each layer; plugging in Piccard's height gives about 10.7 kPa, against roughly 101.4 kPa at sea level.
That is about one-tenth of the pressure you live in. Piccard's answer was to seal the cabin so that "air pressure inside the gondola would not be lost as the balloon ascended". To keep that sealed air breathable, he borrowed a Draeger filtering system from German submarines, which used alkaline compounds to absorb unwanted gases.
If pressure units trip you up, our post on why a water barometer would be 10 metres tall shows the same idea using columns of liquid. For an earlier high-altitude flight, read about James Glaisher's high-altitude balloon ascents.
How thin was the air at 15.8 km?
You can check the numbers yourself with the formulas on NASA's Earth atmosphere model page.
Pick the right layer. Between 11,000 m and 25,000 m (the lower stratosphere), NASA's model uses p = 22.65 × exp(1.73 − 0.000157 × h), with p in kPa and h in metres.
Put in h = 15,781. Then 0.000157 × 15,781 = 2.478, and 1.73 − 2.478 = −0.748.
exp(−0.748) ≈ 0.473, so p ≈ 22.65 × 0.473 ≈ 10.7 kPa.
For sea level, use the troposphere formula, p = 101.29 × [(T + 273.1)/288.08]^5.256 with T = 15.04 °C at h = 0. That gives about 101.4 kPa.
Compare: 10.7 ÷ 101.4 ≈ 0.106. Piccard was sitting above about 89% of the atmosphere's weight.
Now a what-if. Suppose the cabin held sea-level pressure (an assumption for this exercise, not a measured value). The pressure difference would be about 101.4 − 10.7 = 90.7 kPa, which is 90,700 newtons pushing outward on every square metre of wall. That is about the weight of a 9-tonne mass (90,700 ÷ 9.8). A sphere is a sensible shape for that job, because the push is the same in every direction.
Why did cosmic rays send Piccard into the stratosphere?
Wikipedia's biography notes that measurements of cosmic radiation were an important motivation for Piccard's upper-atmosphere research. The clue came from an earlier balloonist. In 1912, Victor Hess rose to 5,300 metres and found that the rate of ionisation in the air increased to some three times that at sea level, according to CERN. Hess concluded that penetrating radiation was entering the atmosphere from above.
This is where pressure and cosmic rays meet. The same column of air that sets the pressure also stands between your instruments and space. At 15.8 km, with only about a tenth of that air left overhead by NASA's model, you are measuring the radiation before most of the atmosphere has got in the way.
Piccard's results were rough. The EBSCO account says one approximate observation suggested cosmic rays were more intense in the stratosphere than below, which supported the idea that they come from beyond Earth. For an Indian chapter of this story, read about Piara Singh Gill and the cosmic rays of India.
What can you take from Piccard's flight into a physics exam?
For any pressure-with-height question, use this four-point check:
Name the layer first. The troposphere and the stratosphere use different formulas in NASA's model.
Read pressure as weight of air above per square metre. That one sentence explains both the gondola and the cosmic rays.
Watch units. kPa, atm and bar are easy to mix; convert before you compare.
Sanity-check with a rule of thumb, such as the 4,400 m halving distance above 11 km from NASA's formula.
If the exponential fall in pressure is hard to picture, the Fermi Simulation Lab has interactive simulations for ideas that are easier to see than to read. If the gap is the idea of pressure itself, the Fermi Concept Library gives each physics concept its own lesson and its place in the map.
Next time you see a high-flying aircraft, try working out the pressure outside it.