
On this page
In Class 11 statistics you learn mean deviation, which averages each value's distance from the mean. Then the book squares those distances instead and calls the result variance. Why change a method that seemed to work?
Why can't you just average the deviations?
Deviations from the mean always add up to zero, so their plain average is always zero too. NCERT's Class 11 statistics chapter says this directly: because the sum of deviations from the mean is zero, finding their mean "is not of any use" as a measure of dispersion. We show why in why deviations from the mean always sum to zero.
So you need a way to stop negatives cancelling positives. There are two common fixes:
Take absolute values. The average is the mean deviation, also called mean absolute deviation.
Square each deviation. The average of the squares is the variance, and its square root is the standard deviation.
The same NCERT chapter defines variance as the mean of the squares of the deviations from the mean, written σ² = (1/n)Σ(xᵢ − x̄)². The NIST Engineering Statistics Handbook uses the same idea for a sample, dividing by N − 1 instead of n.
Why does variance square deviations instead of taking absolute values?
Squaring does three jobs at once.
It keeps every deviation positive. A square is never negative, so nothing cancels, and the total is zero only when every value equals the mean.
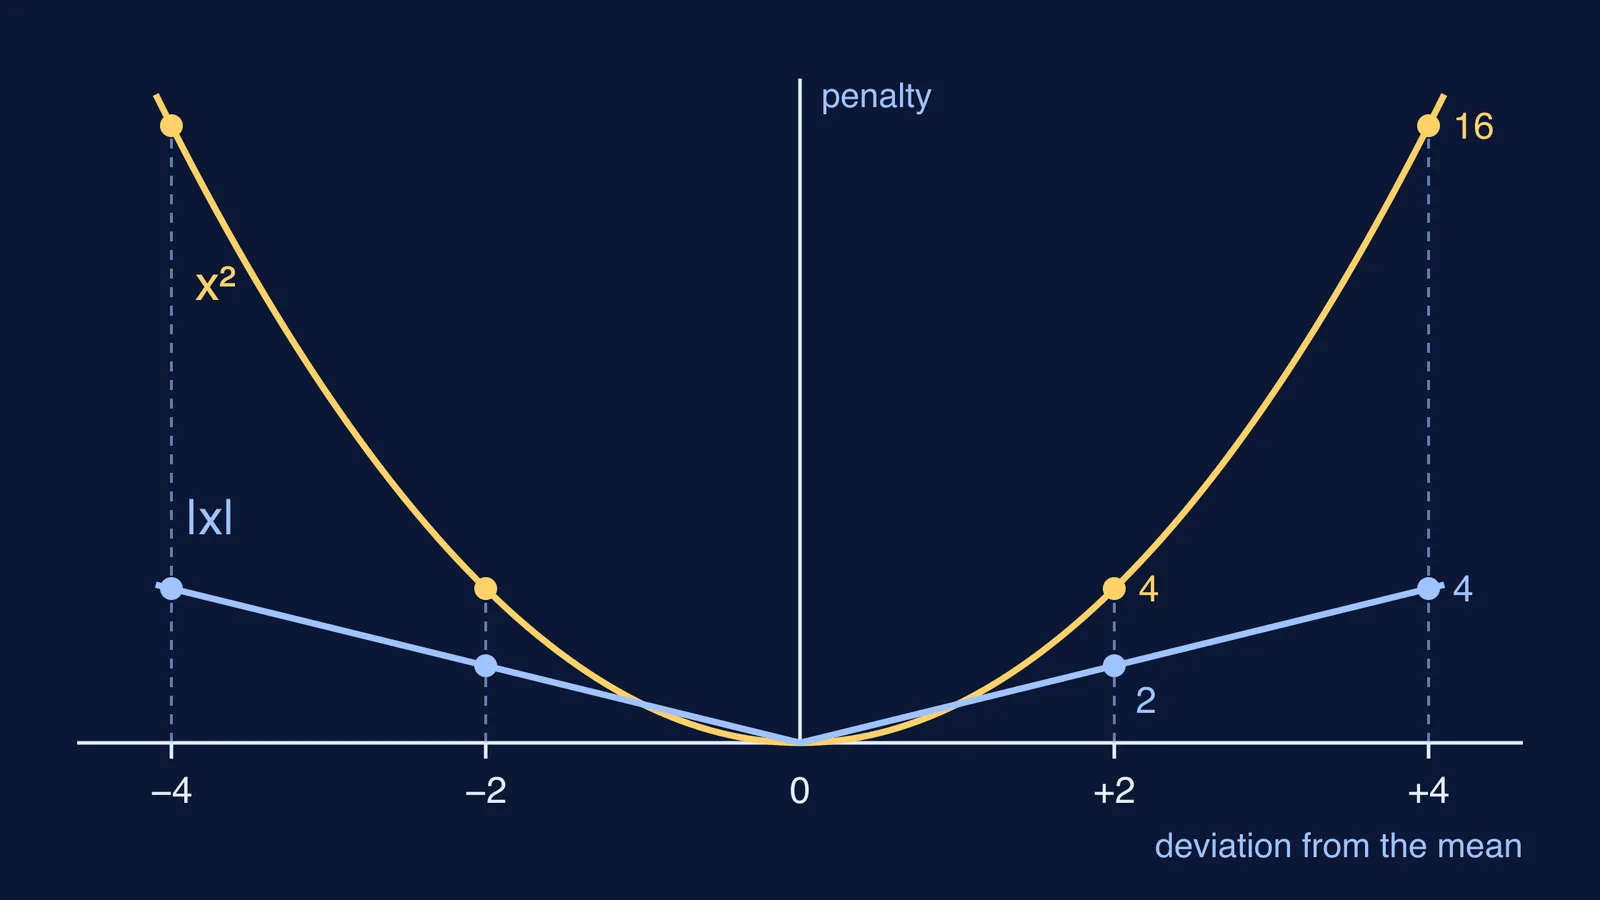
It weights big deviations more. A deviation of 4 counts as 16, not 4. The NIST handbook notes that squaring gives greater weight to values further from the mean, and that the average absolute deviation is less affected by extremes.
It gives algebra that works. NCERT points out that mean deviation is built on absolute values and "cannot be subjected to further algebraic treatment". Squares can be expanded, differentiated and added.
The algebra buys you two things:
A shortcut formula. Expanding (xᵢ − x̄)² gives σ² = (Σxᵢ²)/n − x̄², so you can work from two totals without finding each deviation. Absolute values give no comparable shortcut.
The mean falls out naturally. Treat Σ(xᵢ − a)² as a function of a and differentiate: you get −2Σ(xᵢ − a), which is zero exactly when a = x̄. The mean is the point that makes the squared spread smallest. The graph of |x| has a sharp corner at zero, so this step fails, and the sum of absolute deviations is smallest about the median instead, as our post on mean absolute deviation and the median explains.
A worked example: same mean deviation, different variance
Riya and Arjun each took four mock tests, marked out of 100.
Riya: 48, 48, 52, 52
Arjun: 46, 50, 50, 54
Both average 50.
Riya's deviations are −2, −2, +2, +2. Mean deviation = (2 + 2 + 2 + 2)/4 = 2. Variance = (4 + 4 + 4 + 4)/4 = 4, so the standard deviation is 2.
Arjun's deviations are −4, 0, 0, +4. Mean deviation = (4 + 0 + 0 + 4)/4 = 2. Variance = (16 + 0 + 0 + 16)/4 = 8, so the standard deviation is about 2.83.
Mean deviation calls them equally consistent. Variance does not: two of Arjun's tests were 4 marks from his average, twice as far as any of Riya's, and squaring counts each of those four times as heavily.
That units problem is why the standard deviation, not the variance, is the number usually quoted beside a mean; see variance vs standard deviation and their units.
Is mean absolute deviation ever better?
Yes, and statisticians have weighed the two for decades. Gerstenberger and Vogel (2015) report that for normally distributed data, the asymptotic relative efficiency of the mean deviation compared with the standard deviation is 0.876, or about 88%. In plain terms, when data really are bell-shaped, the standard deviation is the more precise estimate of spread.
The same paper recalls a finding by J. W. Tukey in 1960: if normal data are contaminated by a small fraction of values from a normal distribution with three times the standard deviation, the mean deviation is already the more efficient measure when that fraction is below 1%.
A fair rule follows. Use variance and standard deviation for theory, exams and data that look roughly normal. Report mean deviation, or a median-based measure as the NIST handbook suggests for data with extreme tails, when a few extreme values could dominate.
How do you explain it in an exam answer?
A complete answer to "why is variance preferred?" has three parts:
Squares are never negative, so deviations cannot cancel.
Larger deviations carry more weight.
Unlike absolute values, squares can be handled algebraically, which gives the shortcut formula.
If the idea still feels shaky, the Fermi Concept Library has its own lesson for every concept in mathematics. When a variance calculation goes wrong partway, the Fermi Problem Library has worked problems with a step-by-step solver that explains the reasoning rather than printing an answer.