On this page
The first time your body meets a new antigen, it starts from scratch. The second time, it works from notes. That is why the second antibody response arrives sooner, climbs higher and is made mostly of IgG instead of IgM.
What is the difference between primary and secondary immune response?
The primary immune response is the reaction to the first exposure to an antigen; the secondary immune response is the reaction when the same antigen comes back.
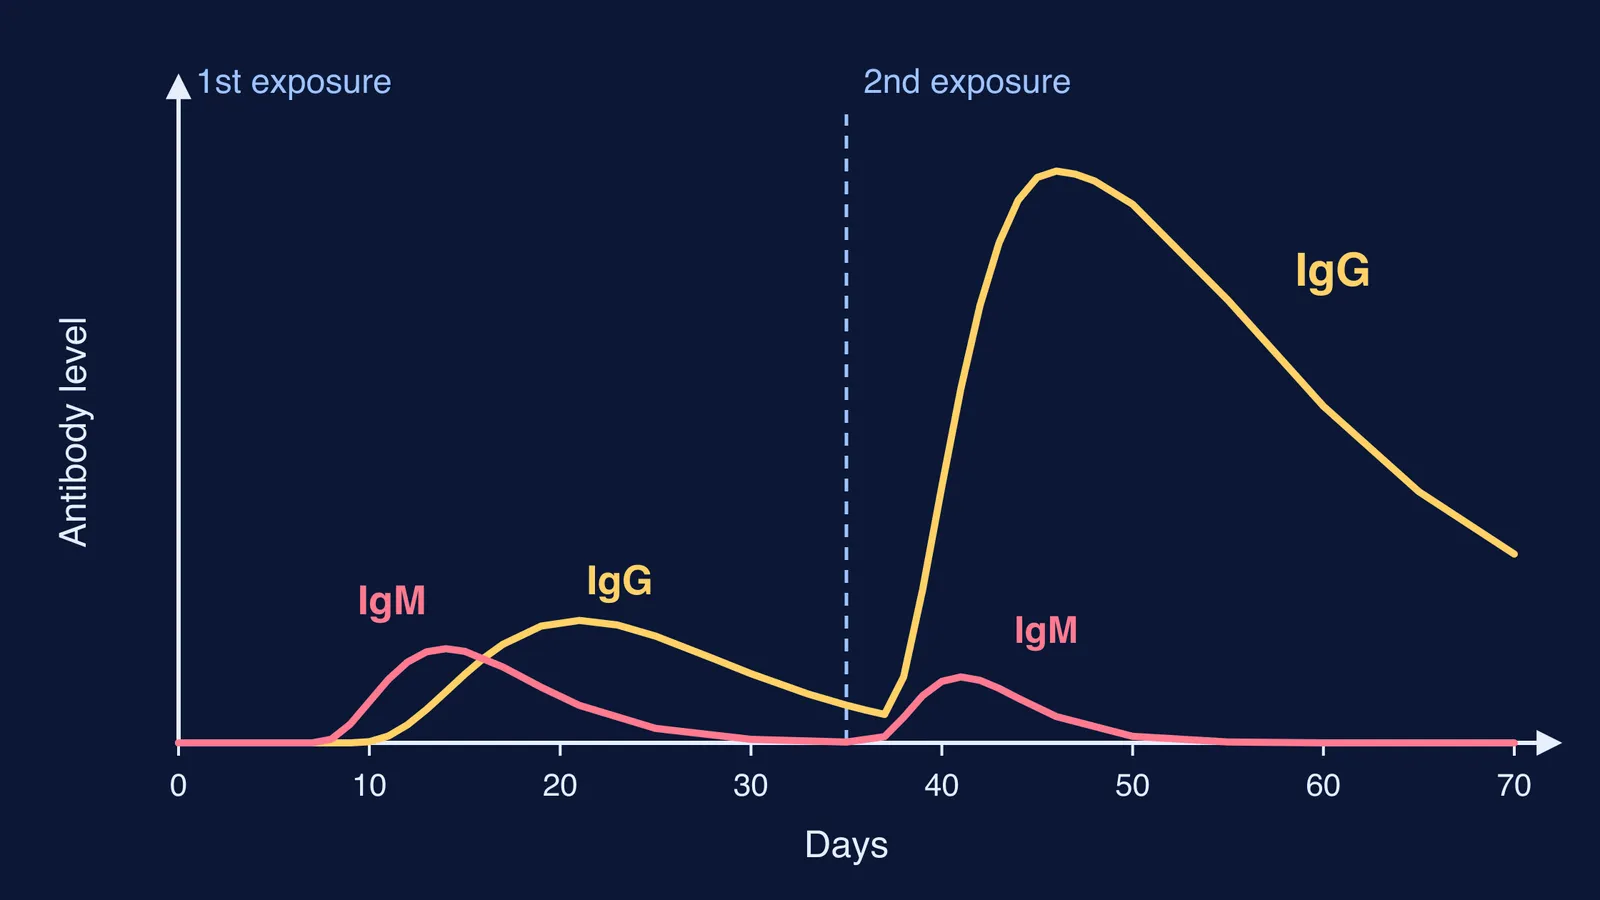
The primary antibody response to a protein antigen begins with a lag period of approximately 10 days, according to OpenStax Microbiology.
In the primary response, IgM peaks around 14 days after exposure, while IgG keeps rising until it peaks about three weeks in (OpenStax Microbiology).
In the secondary response, the lag shrinks to only a few days and IgG production is significantly higher (OpenStax Microbiology). A 2015 paper adds improved antibody affinity to the list (Lutz et al., 2015). The full comparison:
Lag before antibodies appear: about 10 days in the primary response; a few days in the secondary.
Main antibody: IgM rises first in the primary response; the secondary response is mostly IgG.
Size: the secondary response reaches much higher antibody levels.
Duration: secondary antibody levels stay up longer.
Quality: secondary antibodies bind the antigen with higher affinity.
Cells that respond: naive B cells the first time; memory B cells the second time.
If the antibody classes blur together, read the structure of IgA, IgM, IgE and IgG.
Why is the secondary immune response faster and stronger?
The short answer is memory cells. During the primary response, some of the B cells that multiply become memory B cells, programmed to respond to later exposures (OpenStax Microbiology). Three things follow:
They are already there. Nothing has to be built from scratch, so the lag shrinks.
Some have already switched to IgG. In a mouse study, Lutz and colleagues found that reactivated IgG-switched memory B cells drive the formation of IgG-secreting plasma cells (Lutz et al., 2015). Hence a mostly IgG second curve.
Their antibodies fit better. Secondary-response antibodies bind their target epitopes with higher affinity (OpenStax Microbiology).
Unsure which lymphocyte does what? Read B lymphocytes vs T lymphocytes.
How do you draw the primary and secondary response graph?
The timings in these steps come from OpenStax Microbiology; the heights only need to show which curve is bigger.
Draw two axes: time in days along the bottom, antibody level (titre) up the side. Mark the first exposure at day 0 and the second a few weeks later.
After the first exposure, keep both curves flat for about 10 days. Then draw IgM peaking near day 14 and IgG peaking a little later, near week 3. Let both fall.
After the second exposure, leave a gap of only a few days. Then draw a small IgM bump and an IgG curve much taller than the first, which falls slowly.
Label IgM, IgG and both lag phases, and write "memory B cells" beside the second peak.
What does a 3-mark answer look like?
Question: a vaccine is given on day 0 and a booster on day 35. Sketch the antibody response and explain the difference between the two peaks.
Model answer: After the first dose (primary response), antibodies appear only after a lag of about 10 days; IgM peaks first and IgG follows at a low level. After the booster (secondary response), memory B cells formed the first time act within a few days, giving a much larger, longer-lasting rise of mostly high-affinity IgG. Most vaccination strategies rely on this (Lutz et al., 2015).
Our post on the principle of vaccination and memory cells takes the booster idea further.
How long does immune memory last?
It depends on the antigen. A New England Journal of Medicine study followed antibody levels in 45 people for up to 26 years (Amanna, Carlson and Slifka, 2007).
Antibodies against viruses were remarkably stable, with estimated half-lives from 50 years for varicella-zoster virus to more than 200 years for measles and mumps (Amanna et al., 2007).
Antibodies against tetanus and diphtheria fell faster, with estimated half-lives of 11 and 19 years (Amanna et al., 2007).
Questions about your own vaccines or boosters belong with a doctor.
Which mistakes cost marks on this topic?
Drawing the second IgM bump as tall as the second IgG peak.
Starting the secondary curve with no lag at all; the lag is shorter, not zero.
Labelling the y-axis "number of cells" instead of antibody level.
Writing "the second response is faster" without naming memory B cells as the reason.
If IgM and IgG still feel fuzzy, the Fermi Concept Library gives every biology concept its own lesson and its place in the map, so you can go back one step. To be walked through the graph, Fermi's AI tutor draws the figure and checks understanding as it goes.
Tonight, close the book and draw the two-exposure graph from memory, labels and all.