On this page
A probability distribution table lists each value a random variable X can take next to its probability. When some of those probabilities are written with an unknown constant k, the question almost always starts the same way: find k. One rule finds it, and one check stops you from writing down a wrong answer.
How do you find k in a probability distribution table?
For a discrete random variable, each probability lies between 0 and 1, and the probabilities add up to 1, as the OpenStax Introductory Statistics textbook states. So the method is always:
Add every entry in the P(X) row, including any that are just k or 0.
Set the sum equal to 1 and solve for k.
Substitute k back into every entry and check that each one is between 0 and 1.
Step 3 is the one that is easiest to skip. If the sum is linear in k, you get one answer and the check is quick. If k² appears, you get a quadratic with two roots, and usually only one survives.
Worked example: what if the equation for k is quadratic?
Question: X takes the values 0, 1, 2, 3 and 4 with probabilities k, 2k, 2k, 3k² and 3k². Find k, P(X < 3) and the mean of X.
Add the row and set it equal to 1: k + 2k + 2k + 3k² + 3k² = 1, so 6k² + 5k − 1 = 0.
Factor: (6k − 1)(k + 1) = 0, so k = 1/6 or k = −1.
Check k = −1 first. It would make P(X = 0) = −1, and a probability cannot be negative, so reject it.
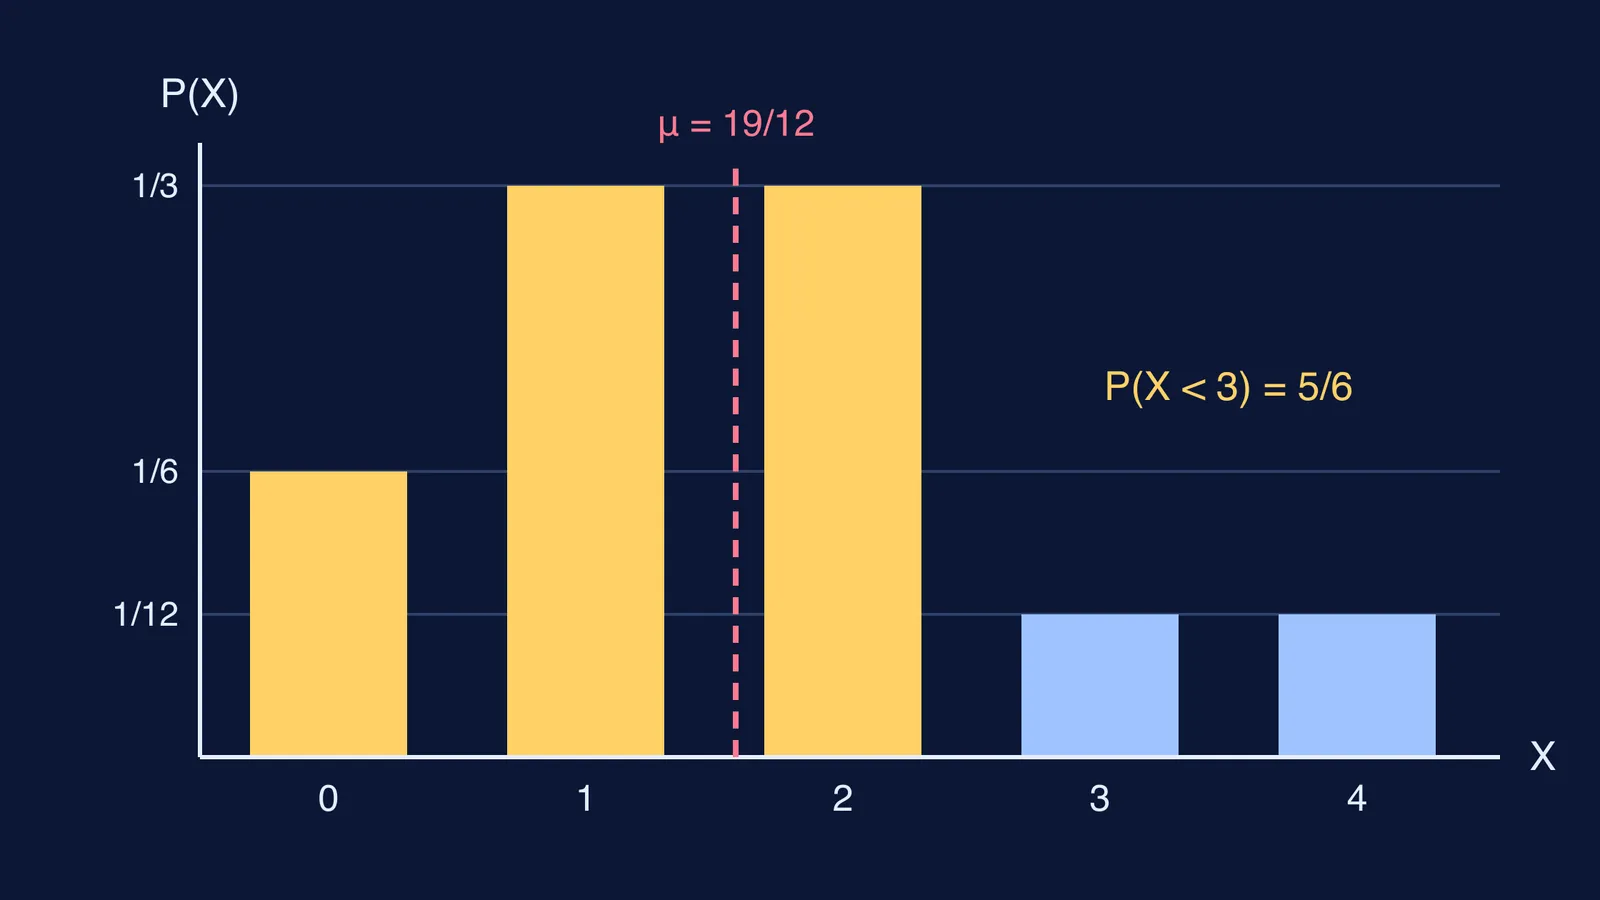
Check k = 1/6. The probabilities become 1/6, 1/3, 1/3, 1/12 and 1/12. Every one is between 0 and 1, and in twelfths they add to 2 + 4 + 4 + 1 + 1 = 12, which is 1. Keep k = 1/6.
How do you find P(X < 3) and the mean once you know k?
P(X < 3) means X = 0, 1 or 2; the value 3 itself is excluded. So P(X < 3) = 1/6 + 1/3 + 1/3 = 5/6.
Cross-check with the complement: 1 − P(X = 3) − P(X = 4) = 1 − 1/12 − 1/12 = 5/6.
For the mean, multiply each value by its probability and add the products; the OpenStax section on expected value writes this as μ = Σ x·P(x). Working in twelfths:
0 × 2/12 = 0
1 × 4/12 = 4/12
2 × 4/12 = 8/12
3 × 1/12 = 3/12
4 × 1/12 = 4/12
The total is 19/12, about 1.58. Sanity check: two thirds of the probability sits on X = 1 and X = 2, and 19/12 lies between them.
If the next part of the question asks for the variance, our walkthrough of mean and variance of a probability distribution takes the same table one step further. If your factorising went fine but you set up the wrong sum, the Fermi Problem Library has worked problems with a step-by-step solver that explains the reasoning rather than printing an answer.
Is this topic still in the CBSE and JEE Main syllabus?
The answer differs by exam. The CBSE Mathematics curriculum for 2026-27 lists the Class 12 probability unit as conditional probability, the multiplication theorem, independent events, total probability and Bayes' theorem, with no mention of random variables. NCERT's 2026-27 reprint of the Class 12 probability chapter keeps only a short remark defining a random variable as a real-valued function on the sample space.
The JEE Main 2027 syllabus published by NTA does list "probability distribution of a random variable" under Statistics and Probability. So if you are preparing for JEE Main, or your board still teaches the topic, this method is worth practising until it is automatic. For the CBSE board paper, go by your school's current syllabus.
A five-step checklist for exam day
Write the sum of every P(X) entry and set it equal to 1.
Solve for k; if it is a quadratic, factor it or use the formula.
Substitute each root into every entry and reject any root that gives a value below 0 or above 1.
Read the inequality: < leaves out the endpoint, ≤ keeps it.
For the mean, build an x·P(x) column, add it, and check the answer lies between the smallest and largest X.
For more practice building tables from scratch, try the distribution of the maximum of two dice and the 1 − qⁿ shortcut for at least one success. If the idea of a random variable itself still feels shaky, look it up in the Fermi Concept Library and come back to the table afterwards.