
On this page
India's 2026 monsoon came in below normal in a year when El Niño developed in the Pacific. The India Meteorological Department's 2026 end-of-season report says June to September rainfall was 87% of the long period average (LPA): 759.4 mm against a normal of 868.6 mm. In May, IMD's updated forecast had warned that El Niño conditions were likely to develop during the season, and in October NOAA's ENSO diagnostic discussion said El Niño was still strengthening.
What is El Niño, in one sentence?
El Niño is "a warming of the ocean surface, or above-average sea surface temperatures (SST), in the central and eastern tropical Pacific Ocean", according to NOAA Climate.gov. During El Niño, the same explainer says, the surface winds that normally blow from east to west along the equator weaken, or sometimes reverse.
Weaker winds let warm water slide east, and warmer water in the east weakens the winds further. Our post on Jacob Bjerknes and the feedback loop behind El Niño explains how that loop keeps itself going.
How does El Niño affect the Indian monsoon?
Start with heat exchange between ocean and air. Warm sea water heats the air above it and loads it with water vapour, so the air rises. As it rises it cools, the vapour condenses into cloud and rain, and condensation releases heat that keeps it rising. Over cooler water, air stays cool and dry, and sinks.
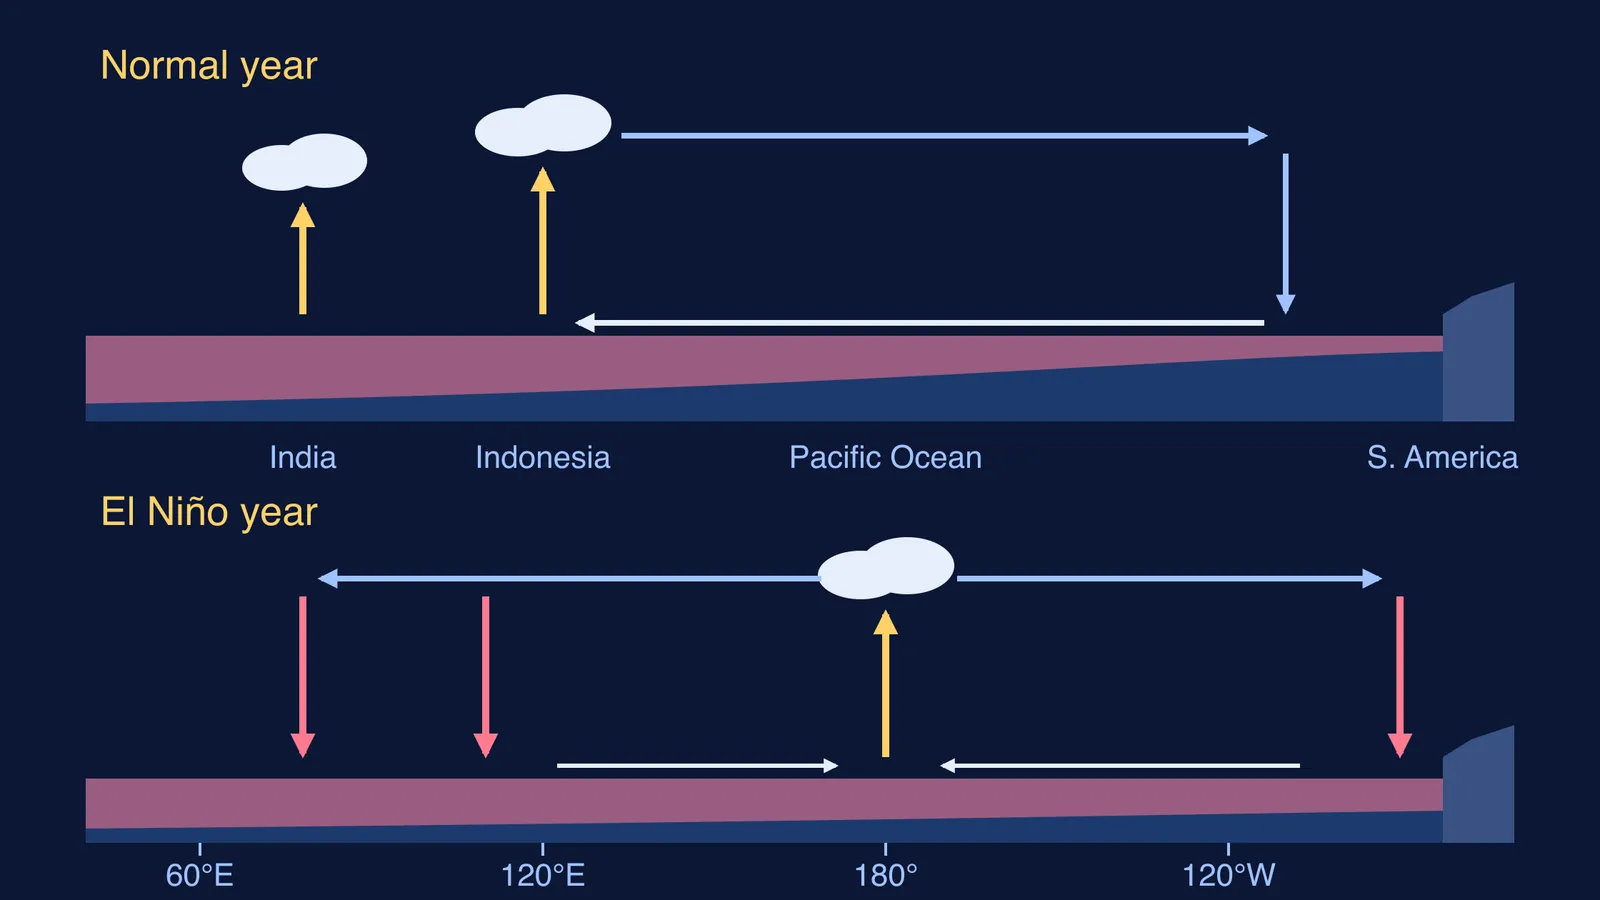
Normally the warmest water sits in the western Pacific, near Indonesia. NOAA's guide to the Walker circulation puts it simply: above this warm pool air rises, and above the cooler water in the east, air "dries and settles near the surface".
In an El Niño year the warm pool moves east and the rising branch follows it. Over Indonesia and its neighbours, the same NOAA article says, "upward flow weakens, and anomalous sinking motion occurs", while rising motion increases over the central Pacific.
Sinking air is the problem for India: it is squeezed, warmed and dried, so clouds struggle to form. A 2006 study in Science by K. Krishna Kumar and colleagues (Kumar et al., 2006) describes El Niño "focusing drought-producing subsidence over India"; subsidence is the meteorologist's word for sinking air. For the monsoon's own engine, the summer heating of land against sea, read what causes the Indian monsoon winds to blow.
Does El Niño always mean a drought in India?
No. Kumar and colleagues examined India's 132-year rainfall record and found that severe droughts have always come with El Niño events, but El Niño events have not always produced severe droughts (Science, 2006). Research points to three things that can change the outcome.
Where the Pacific warms most. El Niño events with the warmest water in the central equatorial Pacific pushed sinking air over India more effectively than events warmest in the eastern Pacific, the 2006 study found.
The Indian Ocean. The Indian Ocean Dipole (IOD), a see-saw of sea temperatures across the Indian Ocean, can either counter or support El Niño's effect on monsoon rain, according to Ashok, Guan and Yamagata (2001) in Geophysical Research Letters.
A shifting pattern and warming land. An earlier paper (Kumar, Rajagopalan and Cane, 1999) found that the El Niño-monsoon link had broken down in the decades before 1999. Its two possible reasons: a southeastward shift in El Niño's Walker circulation changes, which may leave less sinking air over India, and Eurasian warming, which may strengthen the land-ocean contrast driving the monsoon.
Worked example: how do you read a monsoon number?
IMD reports rain as a percentage of the long period average. Do the arithmetic yourself, using IMD's 2026 end-of-season report.
Find the normal. The all-India LPA for June to September is 868.6 mm.
Find the actual. The country received 759.4 mm.
Divide. 759.4 / 868.6 = 0.874, so about 87% of LPA.
Find the shortfall. 868.6 - 759.4 = 109.2 mm, about 12.6% below normal; IMD's map rounds it to -13%.
Check the regions. South Peninsula got 542.0 mm against 716.2 mm (76%); Central India got 952.8 mm against 978.0 mm (97%).
Check the months. June was 65% of LPA; July was 101%.
For any El Niño year, ask: what did the Pacific do, what did the Indian Ocean do, and which regions and months fell short?
How can you picture the Walker circulation?
Sketch two cross-sections along the equator, one normal year and one El Niño year, and mark the warm water, rising air and sinking air; the diagram above is a template. The same physics, on a smaller scale, explains why the sea breeze blows towards land during the day.
If convection still feels abstract, the Fermi Simulation Lab has interactive simulations for the ideas that are easier to see than to read. For convection and latent heat themselves, the Fermi Concept Library gives each concept its own lesson.
When IMD issues its next monsoon forecast, read the El Niño and IOD lines first: they tell you which way the odds lean.