

On this page
In 1969 the meteorologist Jacob Bjerknes published "Atmospheric teleconnections from the equatorial Pacific" in *Monthly Weather Review* (Bjerknes 1969, DOI record). Its central idea: the tropical Pacific and the air above it push each other. A review led by NOAA scientist Chunzai Wang says that, in both main frameworks for explaining El Niño, "ENSO involves the positive ocean-atmosphere feedback hypothesized by Bjerknes" (Wang et al., El Niño and Southern Oscillation: A review). That loop reaches all the way to India's rainfall.
Who was Jacob Bjerknes?
According to his National Academy of Sciences biographical memoir, Bjerknes was born in Stockholm on 2 November 1897 and died on 7 July 1975. Before he turned 21, he wrote the 1918 paper that set out the frontal cyclone model, the picture of warm and cold fronts that became a main tool of weather forecasting.
He became professor of meteorology at the University of California, Los Angeles, in 1940. Toward the end of the 1950s, at around sixty, he turned to a new field: how the atmosphere and the sea interact. The memoir notes that in El Niño years much of the eastern and middle equatorial Pacific can be up to 2 K warmer than normal.
What is the Bjerknes feedback?
Normally, trade winds blow from east to west along the equator, air rises over the warm western Pacific, flows east high up, and sinks over the cooler eastern Pacific (Wang et al.). Bjerknes called this loop of air the Walker circulation, after Sir Gilbert Walker (NAS memoir). Walker, while working in India from 1903 to 1923, had named a seesaw in air pressure between the Pacific and Indian Oceans the Southern Oscillation (NOAA Climate.gov).
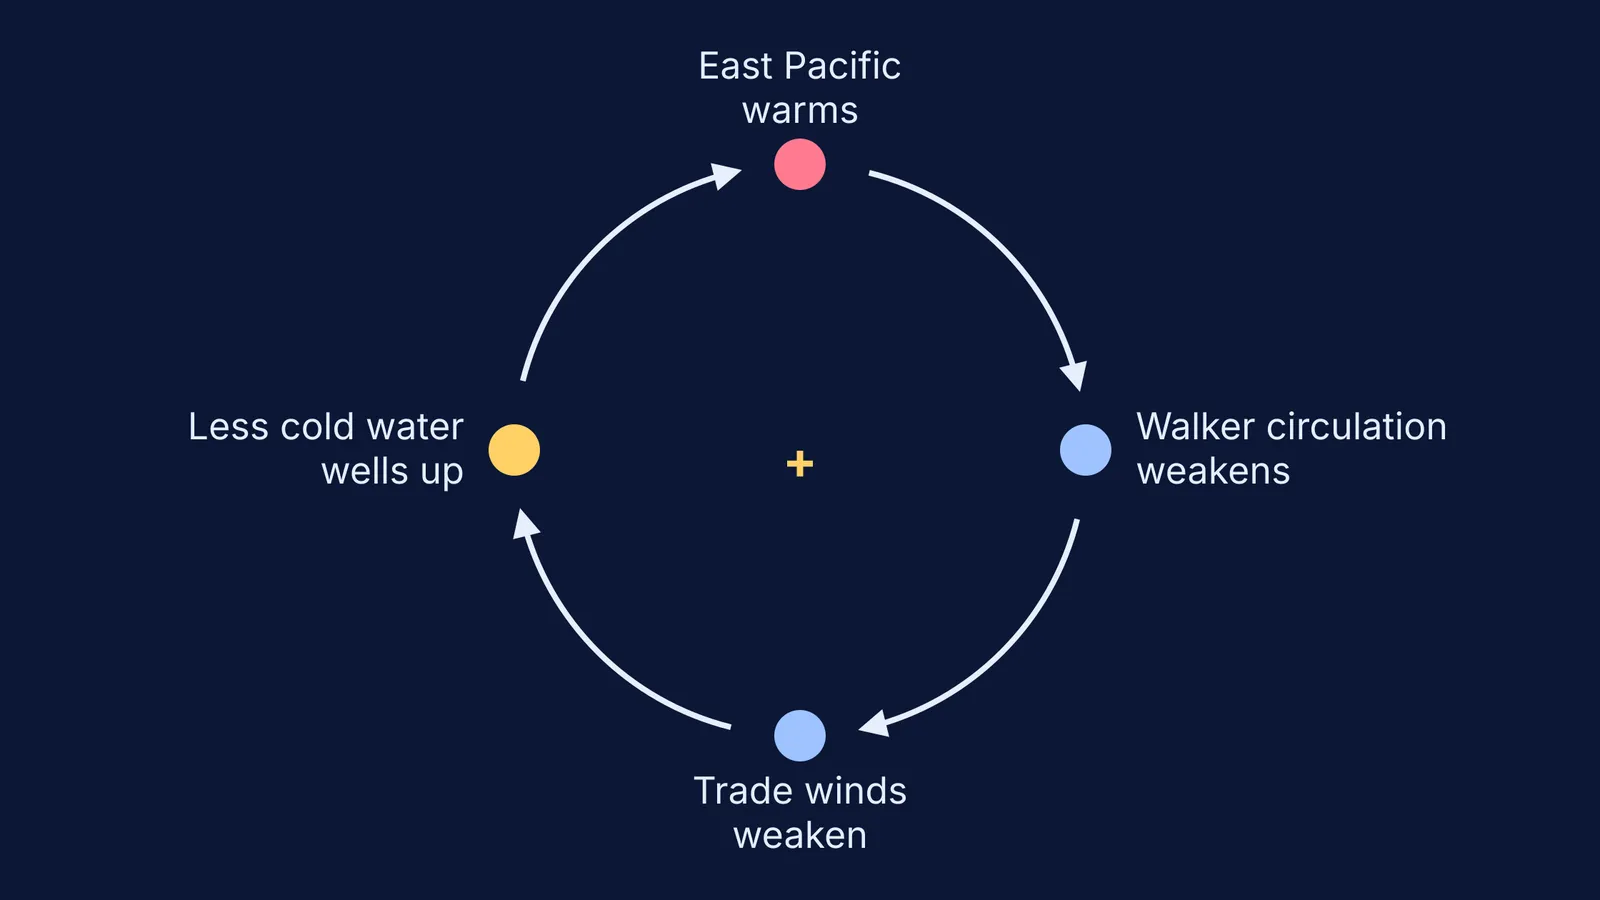
Bjerknes tied Walker's seesaw to El Niño through this chain, as the Wang et al. review summarises it:
The eastern equatorial Pacific warms a little.
The east-west temperature difference shrinks, so the Walker circulation weakens.
The trade winds along the equator weaken.
Weaker winds bring up less cold deep water in the east and carry less water from east to west (NOAA Climate.gov), so the east warms further, and step 1 repeats.
A positive feedback is a loop in which a change causes effects that make the same change bigger. Run the loop backwards, with stronger trade winds and more cold upwelling, and you get La Niña.
How does El Niño affect the Indian monsoon?
The India Meteorological Department says El Niño generally suppresses the Indian summer monsoon by weakening the large-scale circulation that carries moisture towards India (IMD FAQ on ENSO, IOD and the monsoon). The same FAQ lists 1982, 1987, 2002, 2009 and 2015 as major Indian drought years that came during El Niño. It also says ENSO events typically develop every 2 to 7 years, and an El Niño generally lasts 9 to 18 months.
The link is not automatic. IMD says a positive Indian Ocean Dipole can partly offset El Niño's drying. A study of the 132-year Indian rainfall record found that severe droughts have always come with El Niño, but El Niño has not always brought severe drought; events warmest in the central Pacific were more effective at producing drought than those warmest in the east (Krishna Kumar et al., Science, 2006). For the monsoon itself, read what causes the Indian monsoon winds to blow and how Sulochana Gadgil traced the rain band that pulses north over India.
How do you read an El Niño forecast?
IMD's FAQ explains the Oceanic Niño Index (ONI): the three-month running mean of the sea-surface temperature anomaly in the Niño-3.4 region, 5°N to 5°S and 170°W to 120°W (IMD FAQ). An ONI of +0.5°C or more indicates El Niño; 0.5 to under 1.0 is weak, 1.0 to under 1.5 moderate, 1.5 to under 2.0 strong, and 2.0 or more very strong. IMD adds that NOAA's Climate Prediction Center adopted a relative index, RONI, in February 2026, scaled so the same ±0.5°C thresholds still apply.
Worked example: a bulletin says the three-month index is +1.2°C and rising.
Classify it: 1.2 sits between 1.0 and 1.5, so a moderate El Niño.
Trace the loop: a warm east means weak trade winds and a weak Walker circulation.
Check the other drivers IMD names, especially the Indian Ocean Dipole.
Conclude carefully: higher odds of a below-normal monsoon, not a certain drought.
If the loop feels abstract, first watch warm fluid rise and cool fluid sink in our post on how convection currents form in a heated tank. The Fermi Simulation Lab has interactive simulations for ideas that are easier to see than to read, and the Fermi Concept Library gives each physics concept its own lesson.
Next time IMD issues its monsoon outlook, find the ENSO line and run the four steps yourself.


