On this page
Sulochana Gadgil (1944–2025) was a monsoon scientist from Pune. She earned a PhD in applied mathematics at Harvard, joined the Indian Institute of Tropical Meteorology in 1971 and moved to the Indian Institute of Science in Bengaluru two years later, where she helped establish its Centre for Atmospheric and Oceanic Sciences, according to Mongabay India's obituary. She died on 24 July 2025, aged 81.
What did Sulochana Gadgil discover about the Indian monsoon?
For over 300 years the standard picture came from Edmond Halley in 1686: land heats faster than sea, so the monsoon is a gigantic land-sea breeze. In her 2003 review in the Annual Review of Earth and Planetary Sciences, Gadgil quoted the meteorologist Simpson's 1921 objection: India is much hotter in May, before the rains, than in July, and its hottest part, the northwest, gets no rain at all during the monsoon.
The review shows that satellite and other observations support an alternative view: the monsoon as “a manifestation of seasonal migration of the intertropical convergence zone (ITCZ)”, the belt of rising air and rain clouds that circles the tropics (Gadgil 2003).
Key evidence came from the first study of daily satellite pictures over Indian longitudes, by D. R. Sikka and Gadgil in Monthly Weather Review in 1980. Looking at 1973 to 1977, they found two favoured places for the summer cloud band: the monsoon zone over central India, north of 15°N, and the equatorial Indian Ocean, between 0 and 10°N. The monsoon cloud band is established by the northward movement of the cloud zone over the equatorial ocean in April and May.
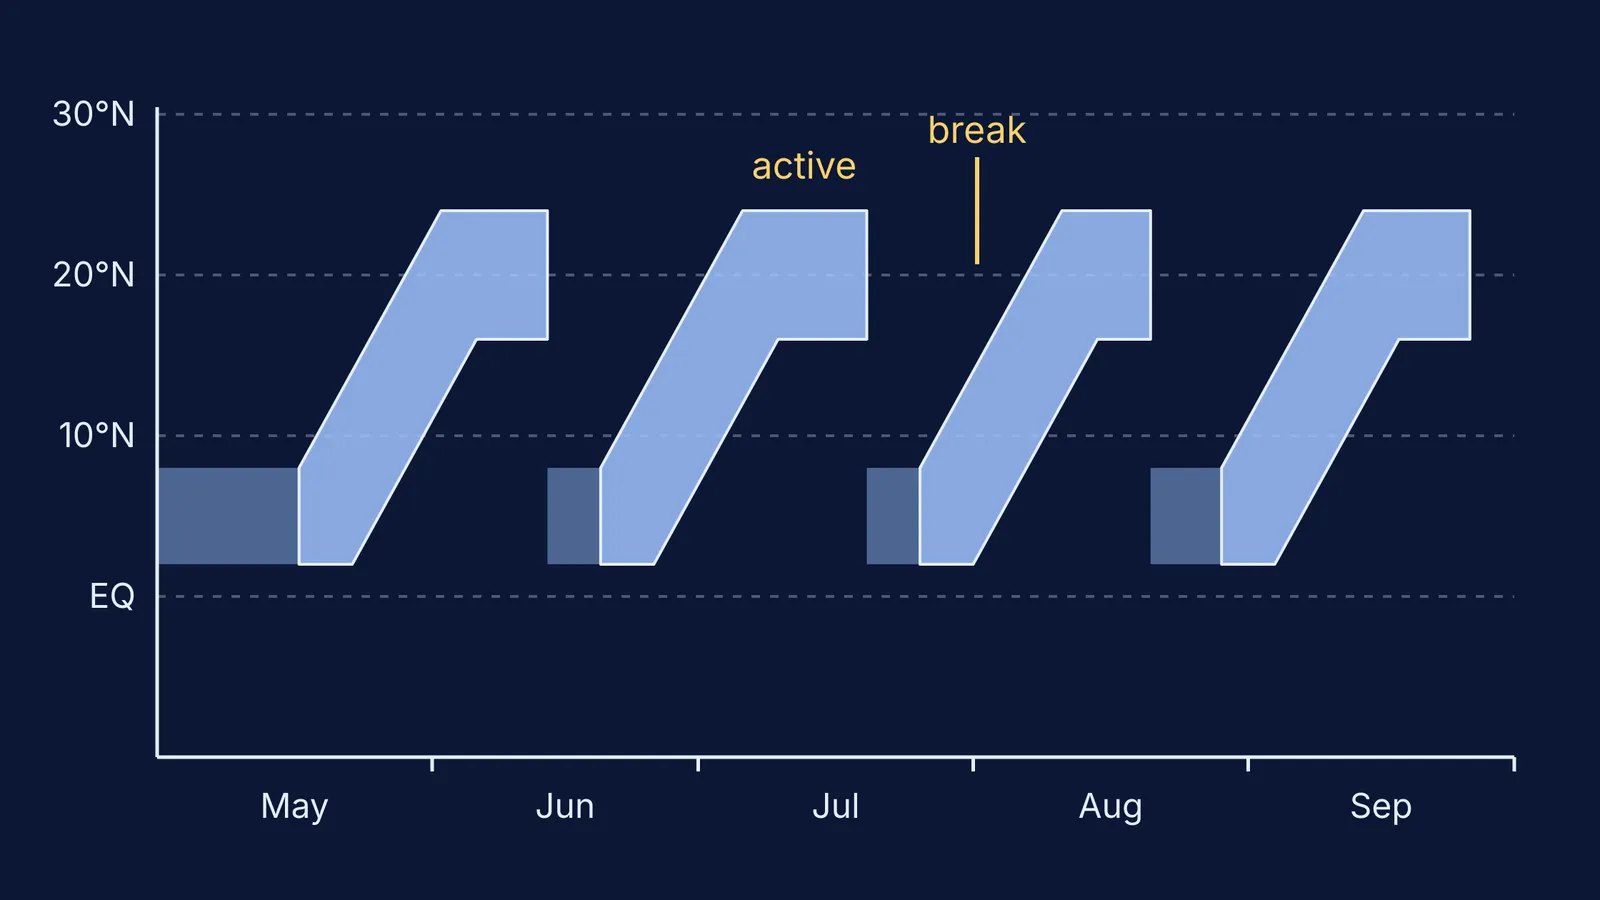
The monsoon's rain band moves north from the equatorial Indian Ocean onto India in repeated pulses, at intervals of 2 to 6 weeks (Gadgil 2003).
Why does the monsoon have active and break spells?
Wet and dry spells within one season were described in 1886 by Henry Blanford, the man behind India's first monsoon forecast, who wrote of “intervals of drought”, as Gadgil's 2003 review recounts.
Gadgil's explanation is a competition between the two favoured zones. In her 2003 review, an active band over the monsoon zone goes with a weak band over the equatorial ocean, and the reverse, like a see-saw. During long, intense breaks the land surface over the monsoon zone heats up rapidly, a heat low forms with sinking air over most of the atmosphere above it, and no rain-bearing disturbances are generated there.
Why does the ocean band form where it does? Gadgil, P. V. Joseph and N. V. Joshi compared cloudiness with sea surface temperature in Nature in 1984. Her review sums up their conclusion as a threshold of about 27.5°C for the Indian Ocean, above which the chance of organised deep convection is high.
Gadgil and Joseph's 2003 study of breaks used daily June to September rainfall at 273 stations from 1901 to 1989, and found all-India seasonal rainfall negatively correlated with the number of break days (correlation −0.58). Central India received 68 cm in 1972, a season with a long break, against 102.7 cm in 1975 (Gadgil 2003).
How did Gadgil bring monsoon science to farmers?
Year to year, all-India summer monsoon rainfall has a standard deviation of only about 10% of the mean, yet it has a very large impact on farm output (Gadgil 2003).
With P. R. Seshagiri Rao and K. Narahari Rao, she studied rainfed groundnut in semi-arid Anantapur, in the Indian peninsula, reported in Agricultural Systems in 2002. The paper lists farm decisions whose best choice depends on rainfall variability or on the prediction for a given year: which crops to grow, whether to spend on fertilisers and pesticides, when to plant and how densely. Working in active collaboration with farmers, the team found that good strategies are “necessarily location specific”.
Worked example: spot a break day the way Gadgil and Joseph did
In her 2003 review, Gadgil explains their rule. The monsoon zone is split into a western part, averaging 6.6 mm of rain a day in July and August, and a wetter eastern part, averaging 11.2 mm a day.
Break day: below 2.5 mm/day in the west and below 7.5 mm/day in the east.
Active day: above 8 mm/day in the west and above 12.5 mm/day in the east.
Try these made-up days:
West 9.1 mm, east 14.0 mm: both above the active thresholds, so an active day.
West 4.0 mm, east 10.2 mm: neither rule applies, so an ordinary monsoon day.
West 1.8 mm, east 6.3 mm: both below the break thresholds, so a break day.
West 2.1 mm, east 9.0 mm: dry in the west only, so not a full break day.
From 1901 to 1989, both parts were below the break thresholds on 16% of days and both above the active thresholds on 14% of days, the review reports.
For the physics underneath the monsoon, such as convection and pressure, the Fermi Concept Library gives each concept in physics its own lesson, and the Fermi Simulation Lab has interactive simulations for ideas that are easier to see than to read.
Read next: Gilbert Walker and the Southern Oscillation and Jagadish Shukla on why the monsoon can be predicted.