

On this page
Picture a tank of still water, a heater under its bottom-left corner and a few drops of dye. Before you press play, predict where the dye will go. The gap between your guess and what happens teaches convection better than a definition.
How do convection currents form in water?
Convection is "the transfer of heat energy in a fluid", as NOAA's JetStream weather school defines it. In water it happens because warm water is less dense than cool water. The USGS Water Science School lists water at 21°C at 0.99802 g/cm³ and water at 37.8°C at 0.99318 g/cm³.
That gap looks tiny, so put a number on it:
Difference in density: 0.99802 − 0.99318 = 0.00484 g/cm³, about 0.5%.
One litre of the warm water has 4.84 g less mass than a litre of the cool water around it.
So the surrounding water pushes it up with a net force of about 0.00484 kg × 9.8 m/s², roughly 0.047 N.
Small, but little resists it, so the warm water rises. Cooler water slides in to replace it, gets heated, and the cycle repeats. That moving loop is a convection current.
What happens when you heat one corner of a tank?
Use this predict, observe, explain routine with a convection simulation or a real tank:
Predict. Sketch the tank and draw arrows for where the water will move in the first minute. Write one sentence on why.
Observe. Run it and watch the dye.
Explain. Compare your arrows with what you saw and rewrite your sentence.
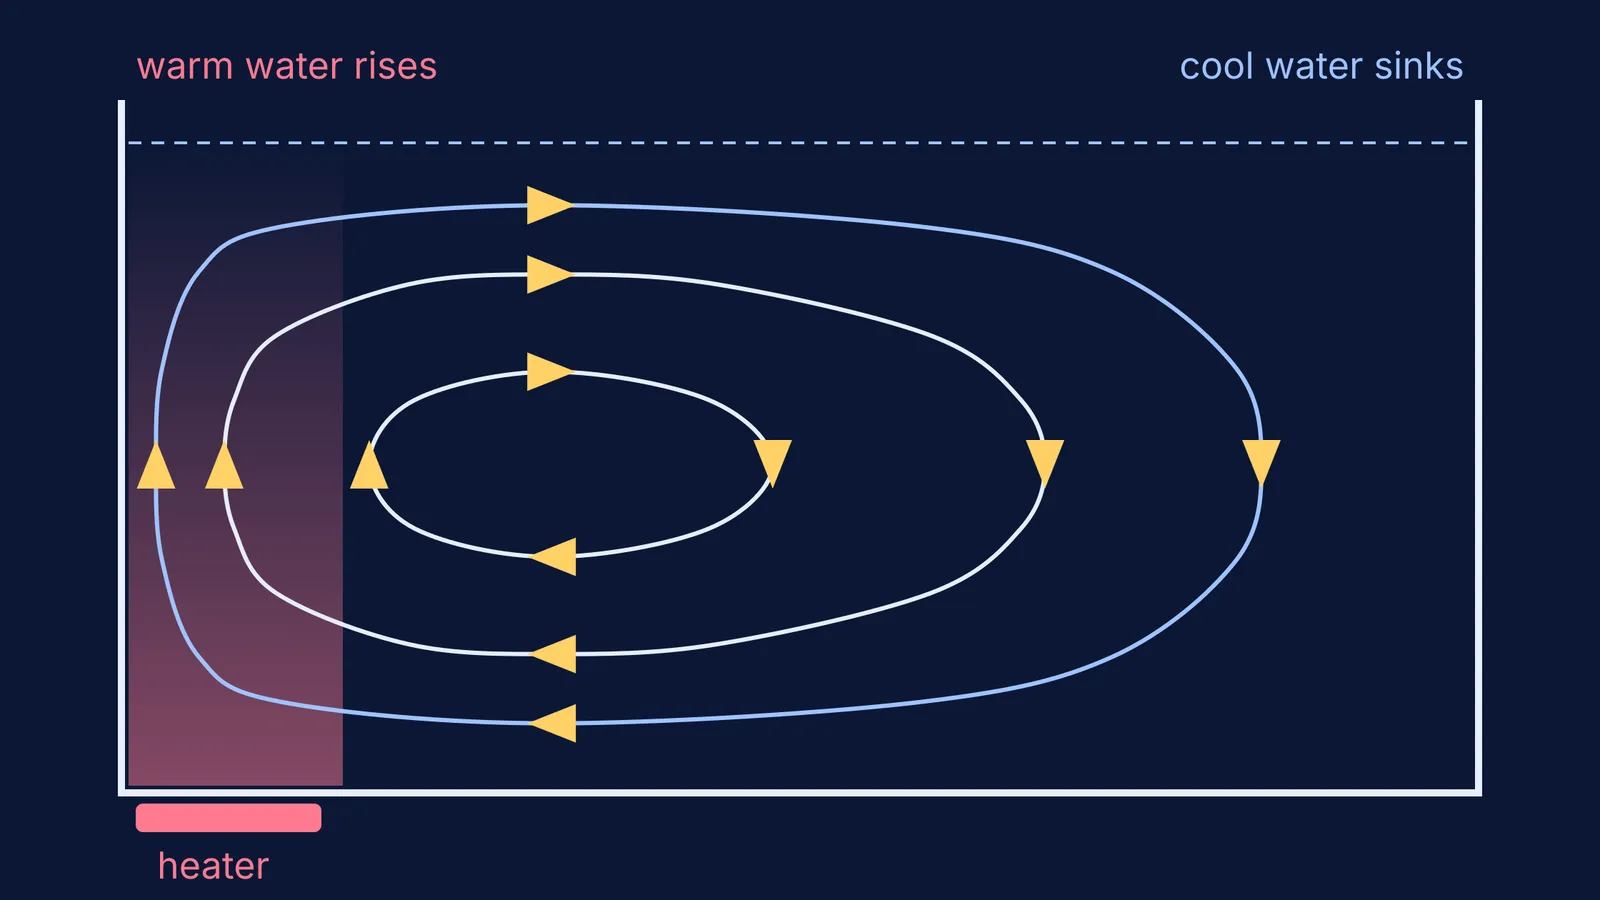
What you should see: a narrow column of warm water rises above the heater, hugging the near wall, and spreads along the surface. Crossing the top it loses heat, sinks slowly over a wide area on the far side and creeps back along the bottom to the heater. The result is one big loop, as in the diagram above. The rising column is narrow, so it moves fast; the return flow fills most of the tank, so it moves slowly.
For more ideas to test this way, the Fermi Simulation Lab has interactive simulations for the ideas that are easier to see than to read.
Where do you see the same loop outside the tank?
Sea breezes are the same loop in air. On a sunny day the land warms the air above it more than the sea does. NOAA explains that cooler, denser air from over the sea moves inland and pushes the warm air up. The air temperature can drop by as much as 8 to 11°C once the sea-breeze front passes, and the loop closes higher up, where NOAA places a zone of higher pressure at about 1,000 to 1,500 metres. At night a weaker land breeze blows the other way. If you have felt the afternoon wind off the sea in Mumbai or Chennai, you have stood in the bottom half of this loop.
A room heater sits low for the same reason the tank heater sits at the bottom. Warmed air rises to the ceiling, spreads, cools, sinks near the far walls and returns along the floor.
Deep inside the Earth, the US Geological Survey says the rock beneath the plates is believed to move "somewhat like a pot of thick soup when heated to boiling", though much more slowly. The plates creep along on top: USGS gives an average spreading rate of about 2.5 cm a year at the Mid-Atlantic Ridge and more than 15 cm a year at the East Pacific Rise. For the geologist behind the idea, read Arthur Holmes and the convection currents inside the Earth.
Can you predict these four variations?
Cover the answers and sketch first.
Heat the top-left corner instead. Answer: almost no current. The warm water is already on top, so it stays there and heat creeps down slowly by conduction.
Heat the middle of the bottom. Answer: two mirror-image loops, rising in the centre and sinking at both side walls.
Cool the top-left corner with ice. Answer: cold water sinks down the left wall, so the loop turns the opposite way to the corner-heated tank.
Heat the bottom-left and cool the top-right. Answer: the same loop as the original tank, but stronger, because both ends now push it round.
If you get one wrong, ask: where does the replacement water come from? For convection beside conduction and radiation, read conduction, convection and radiation explained for Class 7; for when moving pictures beat textbook figures, see simulations or static diagrams, and what studies found.
If a prediction keeps going wrong and you cannot see why, Fermi's AI tutor can draw the figure, run the simulation and check your understanding as it goes.


