
On this page
Describing Motion Around Us is Chapter 4 of Exploration, the new NCERT Class 9 science textbook used from the 2026-27 session, first published in April 2026 (NCERT, Exploration contents). It opens by asking how big a gap to keep behind a truck; by the end you can answer with numbers. If speed and simple graphs feel rusty, start with our Class 7 guide to motion, speed and graphs.
What is in Chapter 4 of the new Class 9 science book?
The chapter covers position and displacement, average speed, velocity and acceleration, position-time and velocity-time graphs, the kinematic equations for constant acceleration, and uniform circular motion.
In the CBSE 2026-27 Class IX science curriculum, it sits in Unit III, Motion, Force, Work and Sound, which carries 23 of the 80 theory marks. The curriculum expects you to derive the kinematic equations by the graphical method.
What is the difference between distance and displacement?
Distance travelled counts every metre covered; displacement is the net change in position, with a direction (NCERT Chapter 4). Walk 300 m east to a chai stall, then 120 m back west: distance 420 m, displacement 180 m east.
If that walk took 360 s, your average speed was 420 ÷ 360 ≈ 1.17 m/s, but your average velocity was 180 ÷ 360 = 0.5 m/s east. They match only if you never turn back.
How do you read position-time and velocity-time graphs?
Two rules carry most graph questions:
On a position-time graph, the slope is velocity; a flat line means rest.
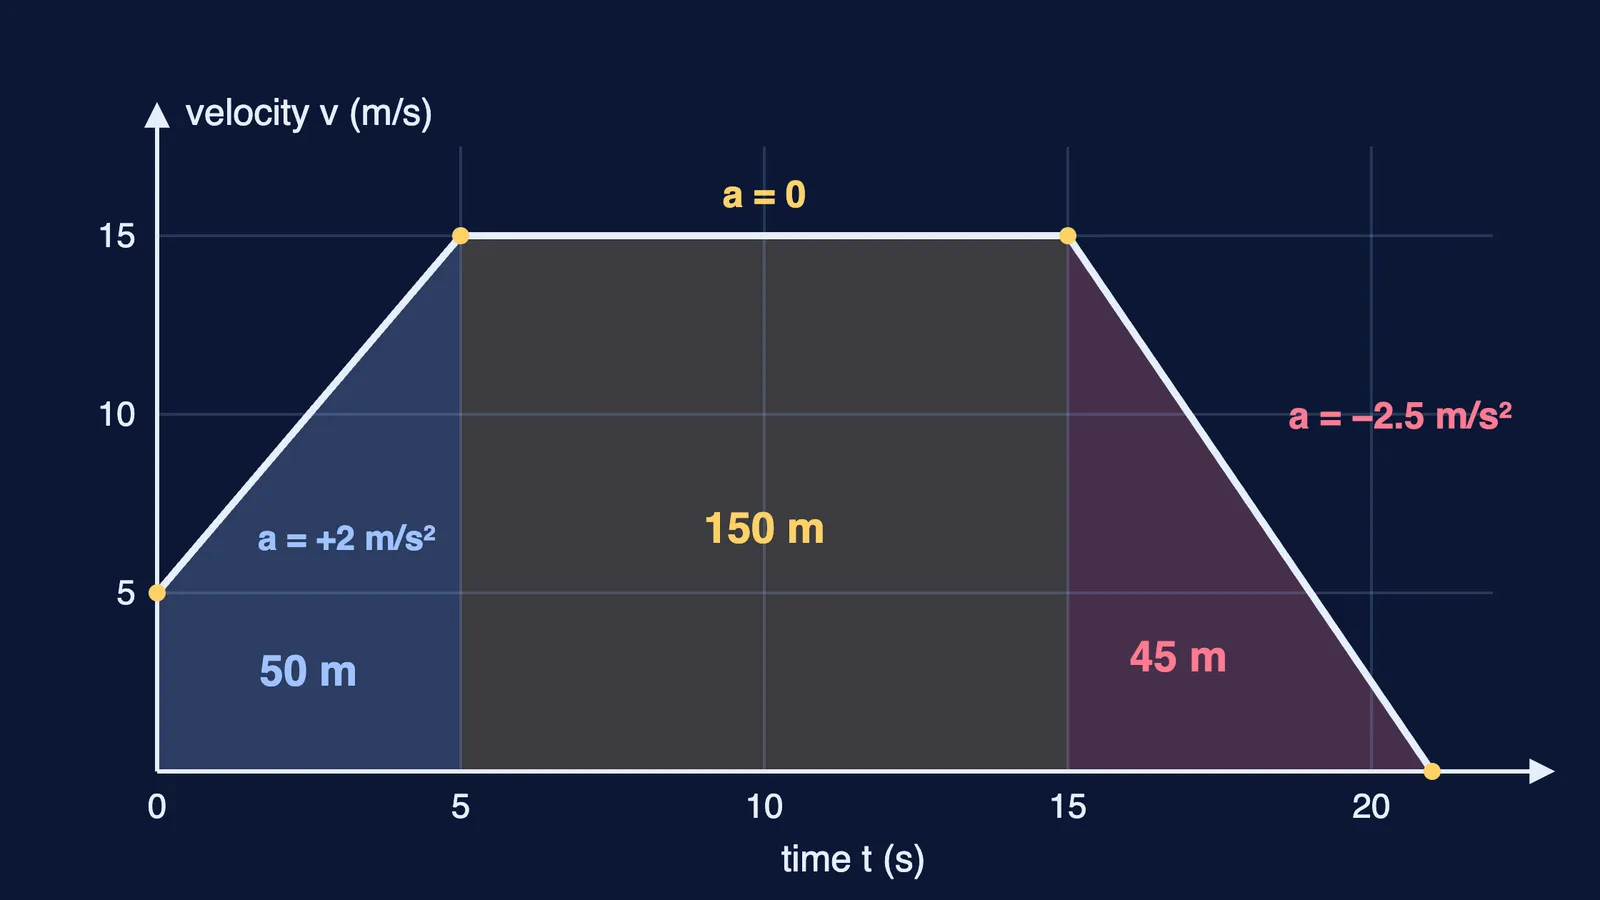
On a velocity-time graph, the slope is acceleration and the area under the line is displacement.
The chapter also reminds you that "a graph is not a route map": it shows position against time, not the path.
Worked example (the graph at the top): a scooter at 5 m/s speeds up steadily to 15 m/s in 5 s, cruises for 10 s, then brakes to a stop in 6 s, on a straight road.
Slopes: (15 − 5) ÷ 5 = 2 m/s², then 0, then (0 − 15) ÷ 6 = −2.5 m/s². Minus means the acceleration opposes the motion.
Areas: ½ × (5 + 15) × 5 = 50 m, 15 × 10 = 150 m, ½ × 6 × 15 = 45 m.
Total: 245 m in 21 s, an average velocity of 245 ÷ 21 ≈ 11.7 m/s.
Check: s = ut + ½at² gives 5 × 5 + ½ × 2 × 5² = 50 m for the first stage. If slopes and areas still feel abstract, the Fermi Simulation Lab has interactive simulations for ideas that are easier to see than to read.
How much gap should you keep from the vehicle ahead?
The chapter notes that stopping distance depends on speed, the road surface, the brakes and the driver's reaction time (NCERT Chapter 4). While the driver reacts, the vehicle keeps its speed; then v² = u² + 2as gives the braking distance. With an illustrative 1 s reaction time and braking at −5 m/s²:
At 36 km/h (10 m/s): 10 m reacting plus 10² ÷ (2 × 5) = 10 m braking, 20 m in all.
At 72 km/h (20 m/s): 20 m reacting plus 20² ÷ (2 × 5) = 40 m braking, 60 m in all.
Doubling the speed doubles the reaction distance but quadruples the braking distance; in this example the stopping distance triples. That is why a safe gap must grow faster than speed.
What mistakes cost marks in this chapter?
Not converting km/h to m/s: multiply by 5/18, so 54 km/h is 15 m/s.
Dropping the minus sign when something slows down, or switching the positive direction halfway through.
Using kinematic equations when acceleration is not constant; the chapter says they hold only for constant acceleration.
Mixing up the graphs: a straight sloping line means constant velocity on a position-time graph but constant acceleration on a velocity-time graph.
Calling 2πR/T the average velocity for a full circle. It is the speed; over a full lap the average velocity is zero. A wheel of radius 10 m turning once a minute moves at 2π × 10 ÷ 60 ≈ 1.05 m/s.
When a numerical goes wrong, the Fermi Problem Library has worked problems with a step-by-step solver that explains the reasoning rather than printing an answer.
How should you prepare this chapter for the CBSE 2026-27 exam?
Write each definition in one line with its SI unit.
Plot a position-time graph from your own timings, such as a friend walking past chalk marks every 5 m.
Derive v = u + at and s = ut + ½at² from a velocity-time graph, then eliminate t to get v² = u² + 2as.
Solve ten numericals, checking each with a second equation.
Attempt the end-of-chapter exercises without looking at the worked examples.
Chapter 6, How Forces Affect Motion, builds on this; preview it with our trolley experiment showing how acceleration falls as mass rises.