
On this page
This school practical shows that a heavier object speeds up more slowly under the same pull. You need a trolley, a runway, a pulley, string, slotted masses and a stopwatch.
What does the trolley experiment prove?
It tests Newton's second law. In the NCERT Class 11 Physics chapter Laws of Motion (section 4.5), the law is written F = ma, where F is the net external force and a is the acceleration of the whole system. OpenStax University Physics puts the mass part plainly: acceleration is inversely proportional to mass, so the larger the mass, the smaller the acceleration a given force produces.
So the experiment holds F fixed, changes m and checks whether a changes as 1/m. For the law itself, see our guide to Newton's second law with free-body diagrams.
How do you set up the experiment?
Run a string from the trolley over a pulley at the bench edge to a hanger with a fixed mass, say 50 g. This hanger never changes; it is your constant force.
Compensate for friction: raise the far end of the runway until the trolley, given a gentle push, rolls at a steady speed. A physics teacher's write-up of this practical uses one or two 100 g slotted masses under one end of the runway to get this slope.
Release the trolley from rest and time it over 1.00 m. Repeat three times and take the mean.
Find the acceleration from s = ½at², so a = 2s/t².
Add mass to the trolley, not the hanger, in equal steps.
Record the total moving mass: trolley plus load plus hanger.
Step 6 matters. As schoolphysics explains for this experiment, the falling masses accelerate both the trolley and themselves, so the acceleration is mg/(M + m), with M the trolley and m the hanging mass.
What should your data table look like?
These are calculated, not measured, values from a = mg/(M + m) with g = 9.8 m/s². The hanger is 50 g, so its weight is about 0.49 N, and the distance is 1.00 m.
Total mass 0.50 kg, 1/m = 2.00 per kg, time 1.43 s, a = 0.98 m/s²
Total mass 0.75 kg, 1/m = 1.33 per kg, time 1.75 s, a = 0.65 m/s²
Total mass 1.00 kg, 1/m = 1.00 per kg, time 2.02 s, a = 0.49 m/s²
Total mass 1.25 kg, 1/m = 0.80 per kg, time 2.26 s, a = 0.39 m/s²
Total mass 1.50 kg, 1/m = 0.67 per kg, time 2.47 s, a = 0.33 m/s²
Two quick checks. Doubling the mass from 0.50 kg to 1.00 kg halves the acceleration, from 0.98 to 0.49 m/s². And m × a comes to 0.49 N in every row, which is the hanger's weight.
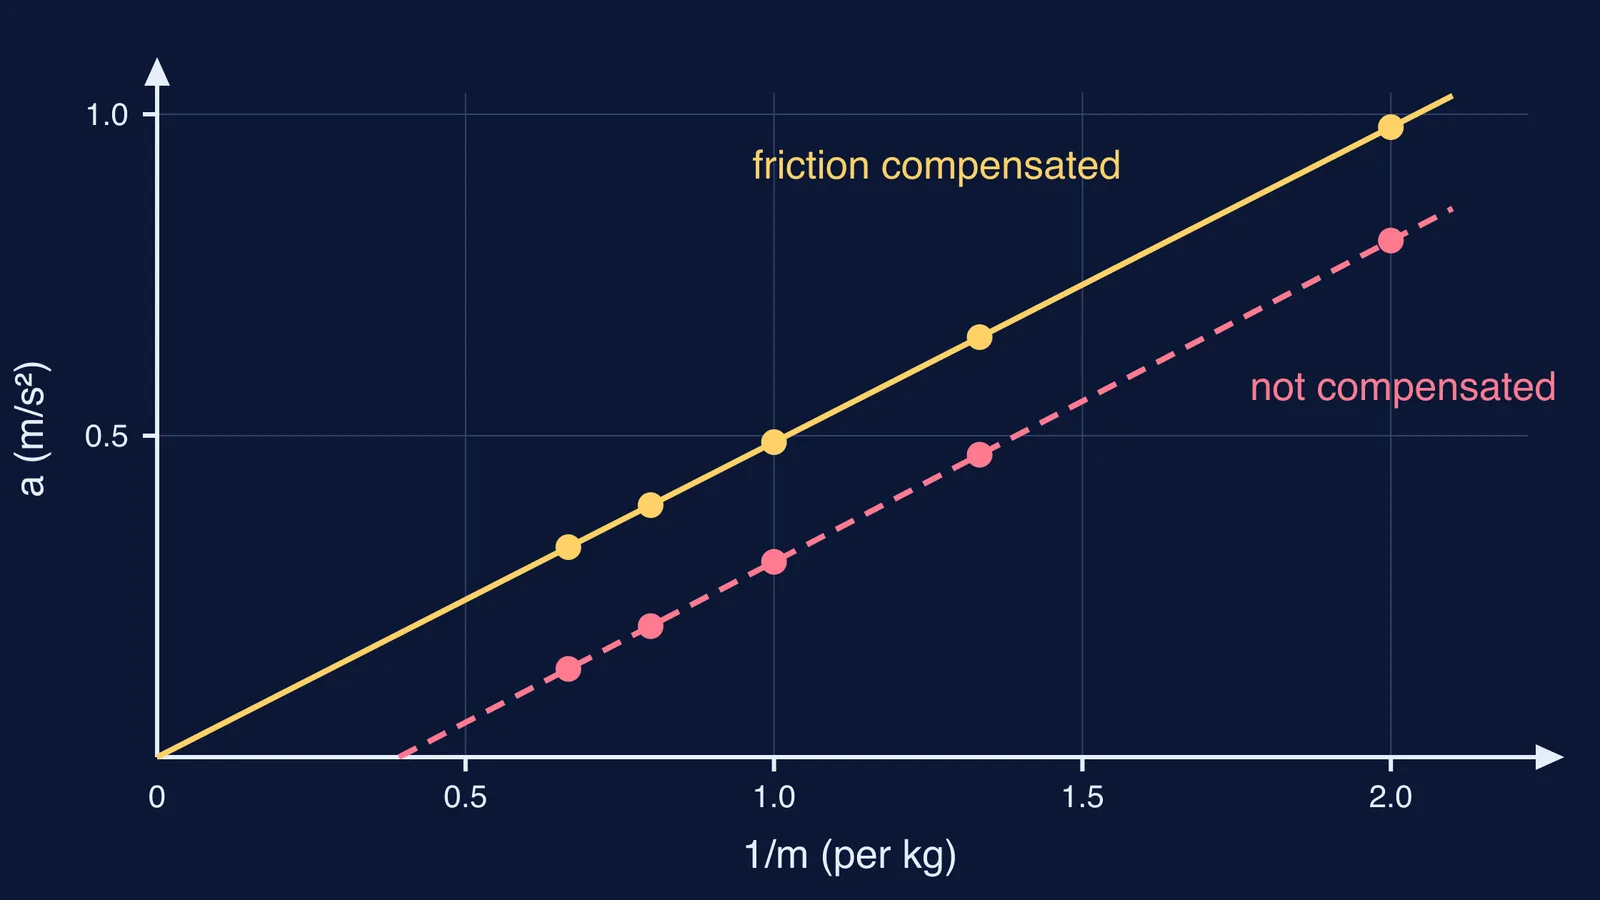
Plot a on the y-axis against 1/m on the x-axis. The points lie on a straight line through the origin, and the slope, 0.49 N, is the pulling force.
Why doesn't my graph go through the origin?
Usually friction, which shrinks the net force in a = F/m. Suppose you skip the tilt and rolling friction is 2% of the trolley's weight (an illustrative figure). The accelerations become 0.80, 0.47, 0.30, 0.20 and 0.14 m/s². Against 1/m they still form a straight line of almost the same slope, but about 0.2 m/s² lower. The heavy end suffers most: the last point is less than half its true value.
How to read your own graph:
Straight, but crossing the 1/m axis to the right of zero: friction is under-compensated. Tilt the runway a little more.
Straight, but crossing the a axis above zero: the runway is tilted too much, and the trolley would creep forward on its own.
Bending, flattening at the light end: you used the trolley's mass alone and left out the hanger. Recalculate with the total mass.
Points scattered on both sides of the line: timing error. Use a longer track, more repeats or a light gate.
Don't force the line through the origin when your points don't head there; it will miss them. Draw the best straight line and read the intercept. Friction is not one fixed number either; our explainer on the friction against applied force graph shows how it rises, peaks and drops.
How do you write the conclusion?
A conclusion to adapt: "With the force held at 0.49 N, the graph of a against 1/m is a straight line through the origin, so acceleration is inversely proportional to mass, as F = ma predicts. The slope, 0.49 N, matches the hanger's weight." Then name your largest error and your fix.
On the road, mass matters less obviously; see our post on whether a heavier car takes longer to stop.
For ideas that are easier to see than to read, the Fermi Simulation Lab has interactive simulations. When this chapter's numericals go wrong, the Fermi Problem Library has worked problems with a step-by-step solver that explains the reasoning rather than printing an answer.