On this page
Your Class 7 chapter on motion and time asks three things of you: work out a speed with the right units, time a pendulum, and tell steady motion from changing motion. In the current NCERT textbook *Curiosity*, this is Chapter 8, Measurement of Time and Motion.
What is speed in Class 7 motion and time?
Speed is the distance an object covers in unit time, according to NCERT's Class 7 chapter. Speed = total distance covered ÷ total time taken. The SI unit of speed is metre per second (m/s), and km/h is also used. The SI unit of time is the second, written s; NCERT points out that 'sec' and 'hrs' are wrong symbols. Speed found this way is really the average speed.
Worked example: a school bus covers 18 km in 30 min. What is its speed in km/h and in m/s?
Match the units: 30 min = 0.5 h.
Speed = 18 km ÷ 0.5 h = 36 km/h.
In SI units: 18,000 m ÷ 1,800 s = 10 m/s.
Check with the shortcut: 1 km/h = 1000 m ÷ 3600 s = 5/18 m/s, and 36 × 5/18 = 10. Same answer.
What is the time period of a simple pendulum?
A simple pendulum is a small metal ball, the bob, hung from a rigid support by a long thread, as NCERT's chapter defines it. One oscillation is the bob moving from its mean position to one extreme, across to the other extreme and back. The time period is the time taken for one oscillation. The chapter's key result: the time period of a simple pendulum of a given length is constant at a place, and does not depend on the mass of the bob.
NCERT's Activity 8.2 sets about 100 cm of thread between the support and the bob, times 10 oscillations and divides by 10. For the full routine, see how to time a pendulum's period with a stopwatch, and for swings, clocks and other repeating motion, periodic motion examples for Class 7.
What reading should you expect? For small swings, the period is T = 2π√(L/g), where L is the length and g is the acceleration due to gravity (HyperPhysics, Georgia State University). With L = 1 m and the page's default g = 9.8 m/s², T ≈ 2.0 s, so ten oscillations should take about 20 s. If your stopwatch says 12 s or 35 s, count the oscillations again.
How do you read a distance-time graph?
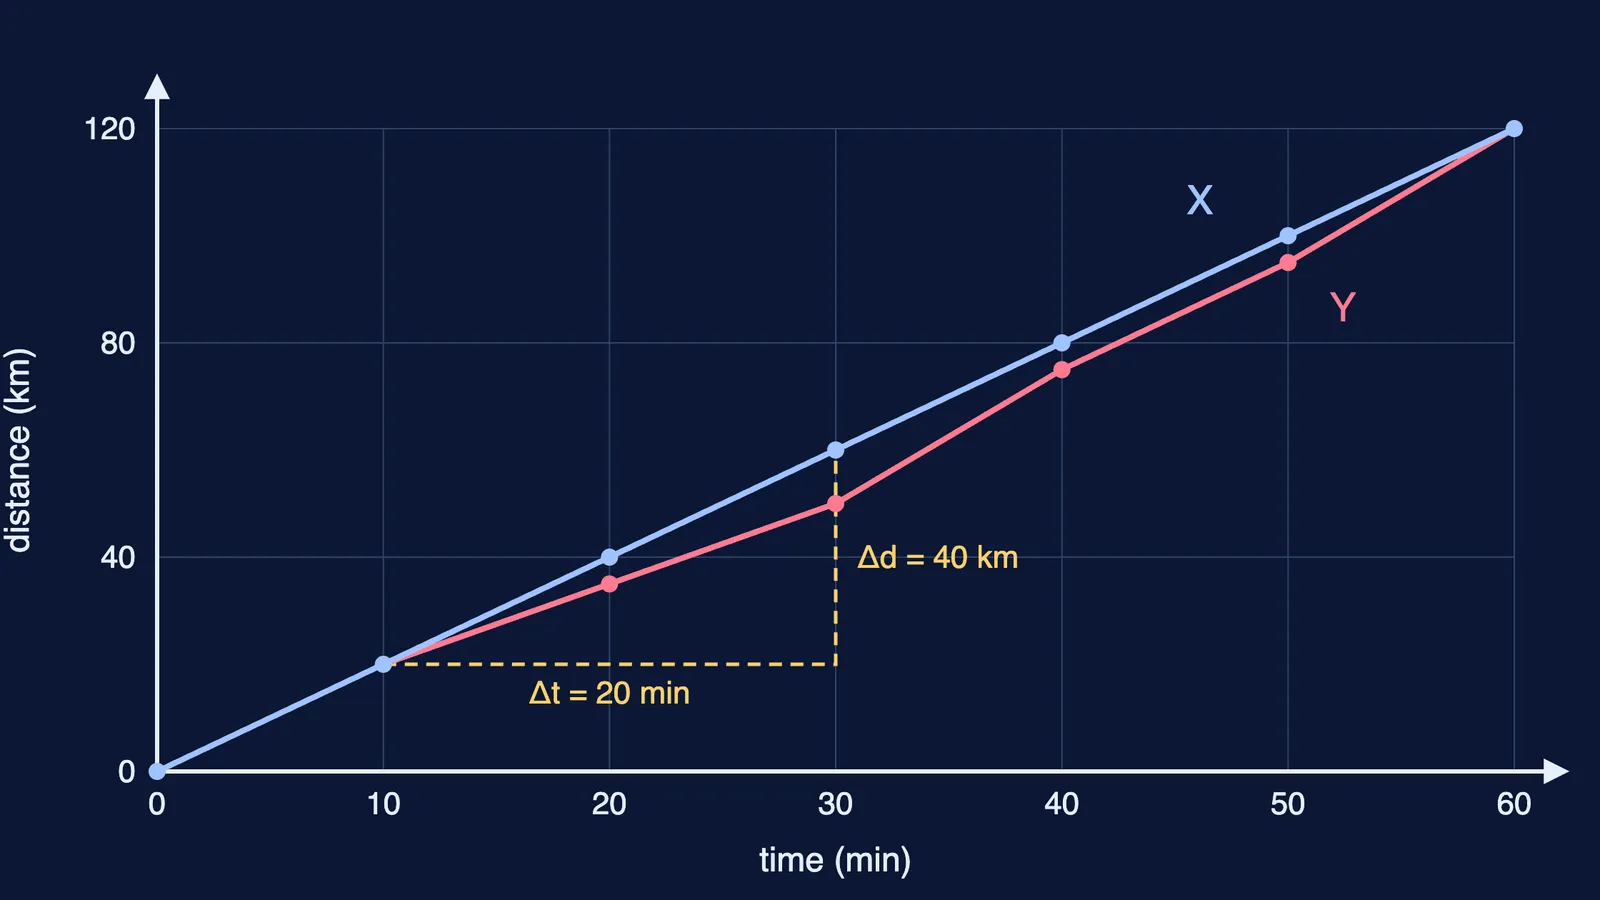
NCERT's Table 8.3 gives the positions of two trains, X and Y, every 10 minutes from 10:00 to 11:00 AM (Chapter 8). Train X covers 20 km in every 10-minute interval. Train Y covers 20, 15, 15, 25, 20 and 25 km. Both are 120 km from the start at 11:00. Plot the table, time across and distance up, as in the diagram above.
Read the graph in three moves:
Shape. Train X's points lie on one straight line: equal distances in equal times, which is uniform linear motion. Train Y's line bends, so its motion is non-uniform.
Steepness. A steeper stretch means more distance per minute, so a higher speed. Train Y's steepest stretches, 10:30 to 10:40 and 10:50 to 11:00, each cover 25 km in 10 min, which is 150 km/h. Its flattest, 10:10 to 10:30, covers 15 km in each 10 min, which is 90 km/h.
Slope as speed. Take two points on Train X's line, 10:10 (20 km) and 10:30 (60 km). Speed = 40 km ÷ 20 min = 2 km/min = 120 km/h.
Train Y's average speed over the hour is also 120 km ÷ 1 h = 120 km/h. Same average, different journeys: a graph shows what a single number hides. Reading speed from two points is the same calculation as finding the slope of a line through two points in maths.
If watching motion unfold helps more than a static plot, the Fermi Simulation Lab has interactive simulations for ideas that are easier to see than to read.
A five-step checklist for any speed numerical
Write down what is given, with units.
Convert to matching units: metres and seconds, or kilometres and hours.
Pick the form: speed = distance ÷ time, distance = speed × time, or time = distance ÷ speed.
Calculate, keeping the units on every line.
Sense-check the answer. In NCERT's Example 8.1, Swati cycles 3.6 km to school in 15 min, which is 4 m/s (Chapter 8); a cyclist at 400 m/s means a slipped conversion.
If a sum still goes wrong, the Fermi Problem Library has worked problems with a step-by-step solver that explains the reasoning rather than printing an answer. And if you don't know where to begin with the chapter, Fermi's AI tutor works out what you already know and builds a plan for the session.
Start with one table: plot Train X and Train Y yourself, then read their speeds off the graph.