On this page
Chapter 2 of the NCERT Class 12 sociology textbook *Indian Society* asks two questions: how fast does a population grow, and what is it made of? Learn two theories, a handful of indicators and a few Census numbers, and you can answer most board questions on it.
What is demography in Class 12 sociology?
Demography is the systematic study of population, from the Greek *demos* (people) and *graphein* (describe), as the NCERT chapter defines it. Formal demography measures and forecasts population change with mathematics. Social demography asks about the wider causes and consequences of that change, which is why sociologists care about it. To see how the raw numbers are collected, read our explainer on how the census is conducted in India.
What did Malthus argue about population growth?
Thomas Robert Malthus (1766–1834) set out his theory in *An Essay on the Principle of Population* in 1798, according to the NCERT chapter. His argument has three steps:
Population grows in geometric progression: 2, 4, 8, 16, 32.
Food and other means of subsistence grow only in arithmetic progression: 2, 4, 6, 8, 10.
So population always outruns food. Preventive checks such as postponing marriage are weak, so positive checks, famines and diseases, become inevitable.
NCERT gives two criticisms, and examiners expect both. First, history proved him wrong: from the late nineteenth century European birth rates fell, while food production and living standards kept rising. Second, liberal and Marxist scholars argued that poverty is caused by the unequal distribution of resources, not by population growth.
What is the theory of demographic transition?
The theory links population growth to economic development and says societies pass through three stages, as the NCERT chapter explains:
Stage 1: low growth in an underdeveloped society, because both birth and death rates are high.
Stage 2: the transitional stage of very fast growth, the 'population explosion', because death rates fall quickly through disease control, public health and better nutrition while birth rates fall slowly.
Stage 3: low growth again in a developed society, because both rates are low.
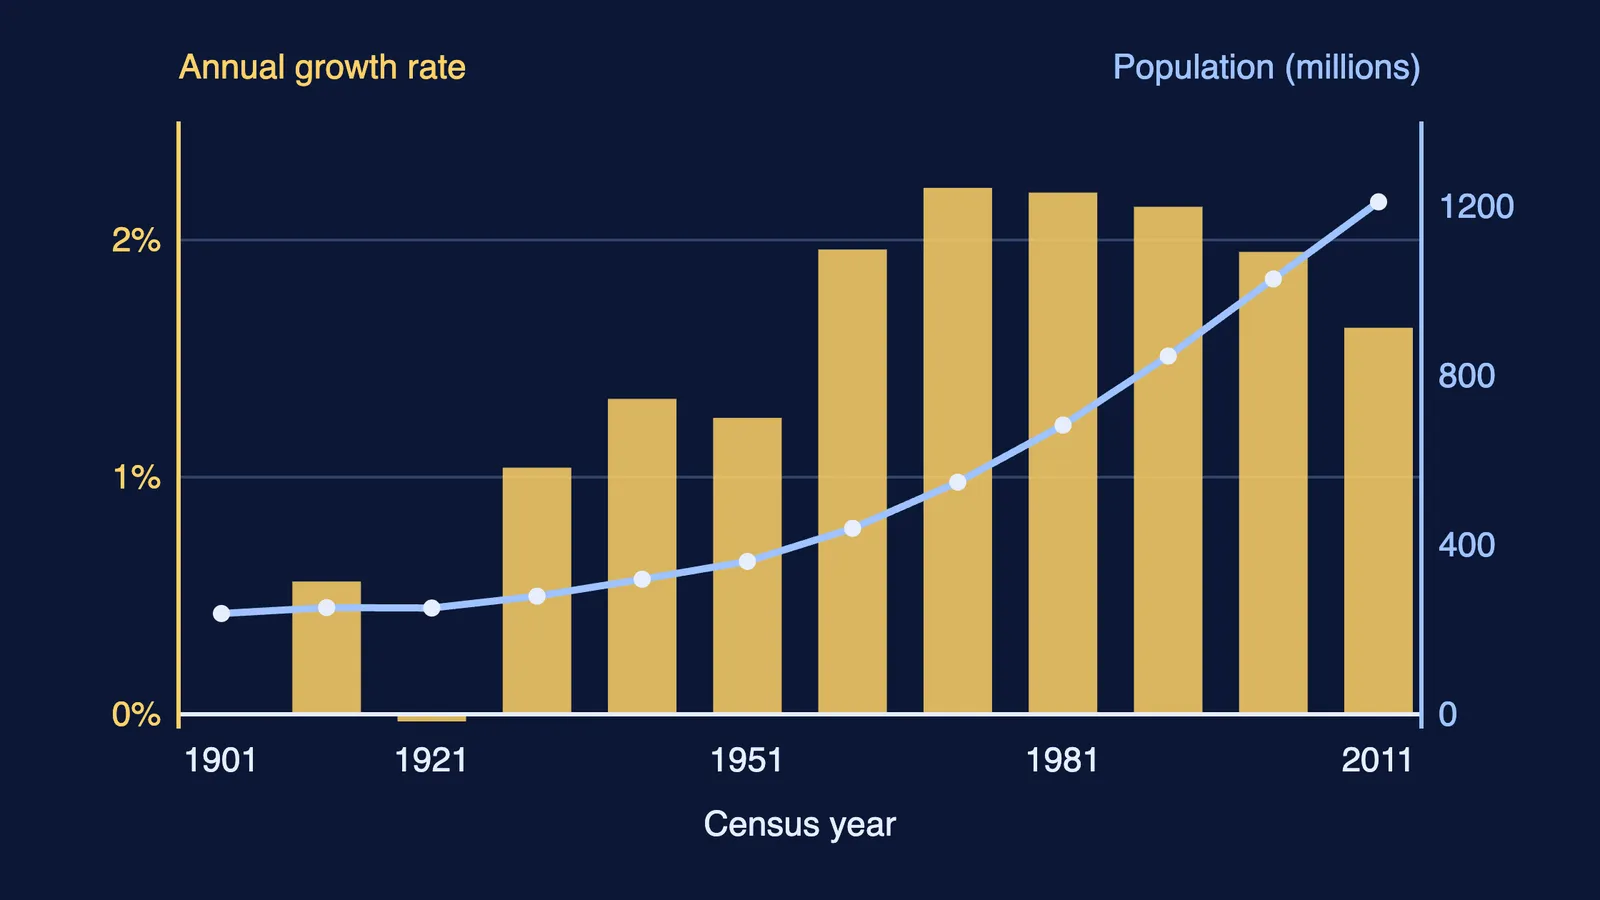
NCERT says India's demographic transition is not yet complete: the death rate has been reduced, but the birth rate has not fallen to the same extent. Its Table 1 shows the average annual growth rate peaking at 2.22% in the decade to 1971 and easing to 1.63% in the decade to 2011, when India's population reached 121 crore.
Fertility has kept falling since. India's total fertility rate was 2.0 in 2021, down from 2.3 in 2014, according to the Sample Registration System figures released by PIB.
Which population indicators should you know?
Most indicators are rates or ratios. These definitions are from the NCERT chapter:
Birth rate: live births per 1,000 population in a year.
Death rate: deaths per 1,000 population in a year.
Rate of natural increase: birth rate minus death rate.
Fertility rate: live births per 1,000 women aged 15 to 49.
Infant mortality rate: deaths of babies under one year per 1,000 live births.
Maternal mortality rate: women who die in childbirth per 1,00,000 live births.
Sex ratio: females per 1,000 males.
Dependency ratio: people under 15 or over 64, divided by people aged 15 to 64, as a percentage.
The Census 2011 figures in the NCERT chapter are worth memorising. The sex ratio was 943, while the child sex ratio (0–6 years) fell to 919. Literacy (age 7 and above) was 73.0%, with men at 80.9% and women at 64.6%. The under-15 share of the population fell from 42% in 1971 to 29% in 2011, and NCERT links this larger working-age group to India's 'demographic dividend'. It stresses that the dividend is not automatic: it depends on education and jobs for the growing working-age group.
For recent mortality, India's infant mortality rate fell from 39 to 27 per 1,000 live births between 2014 and 2021, per the same PIB release on SRS data.
How do you write a 6-mark answer on demographic transition?
Use this five-part plan, which fits on one page:
Define the theory in one sentence: population growth is linked to the level of economic development.
Name the three stages, with the birth and death rate in each.
Explain why stage 2 is an explosion: death rates fall fast, but birth rates respond slowly because reproductive behaviour is slow to change.
Apply it to India: average annual growth peaked at 2.22% in the decade to 1971 (NCERT), and fertility was 2.0 in 2021 (PIB).
Close with a consequence: the demographic dividend, and the condition it depends on.
If the growth maths feels shaky, our post on exponential population growth numericals works through rates step by step, and the Class 9 population notes cover density and age structure from the start. The progressions behind Malthus are mathematics concepts, each with its own lesson in the Fermi Concept Library. And when revision feels too big to begin, Fermi's AI tutor can work out what you already know and build a plan for the session.