On this page
Decay counts plotted directly give a curve, and you can't read a decay constant off a curve with a ruler. Take the natural log of every count first and the curve becomes a straight line whose slope is −λ. Here is why, and one data set worked from raw counts to half-life.
Why is ln N vs t a straight line?
The radioactive decay law says the number of undecayed nuclei left after time t is N = N₀e^(−λt), where λ is the decay constant (OpenStax University Physics, Volume 3). The same source defines λ through the decay rate: −dN/dt = λN, so a bigger λ means a larger share of the nuclei present decays each second.
Take ln of both sides of the decay law:
ln N = ln N₀ − λt
Compare it with y = c + mx, with ln N on the y-axis and t on the x-axis. The intercept c is ln N₀ and the slope m is −λ.
Chemistry uses the same idea: for a first-order reaction, a plot of ln[A] against t is a straight line with slope −k, and t½ = 0.693/k (OpenStax Chemistry 2e). One method serves both subjects.
How do you find the decay constant from the graph?
France's Laboratoire National Henri Becquerel (LNHB) lists the half-life of barium-137m as 2.5545 ± 0.0013 minutes (LNHB decay data for Ba-137m). The counts below are sample data we generated from that half-life, with small scatter added like a real counter run. Each is for the same short interval, once a minute.
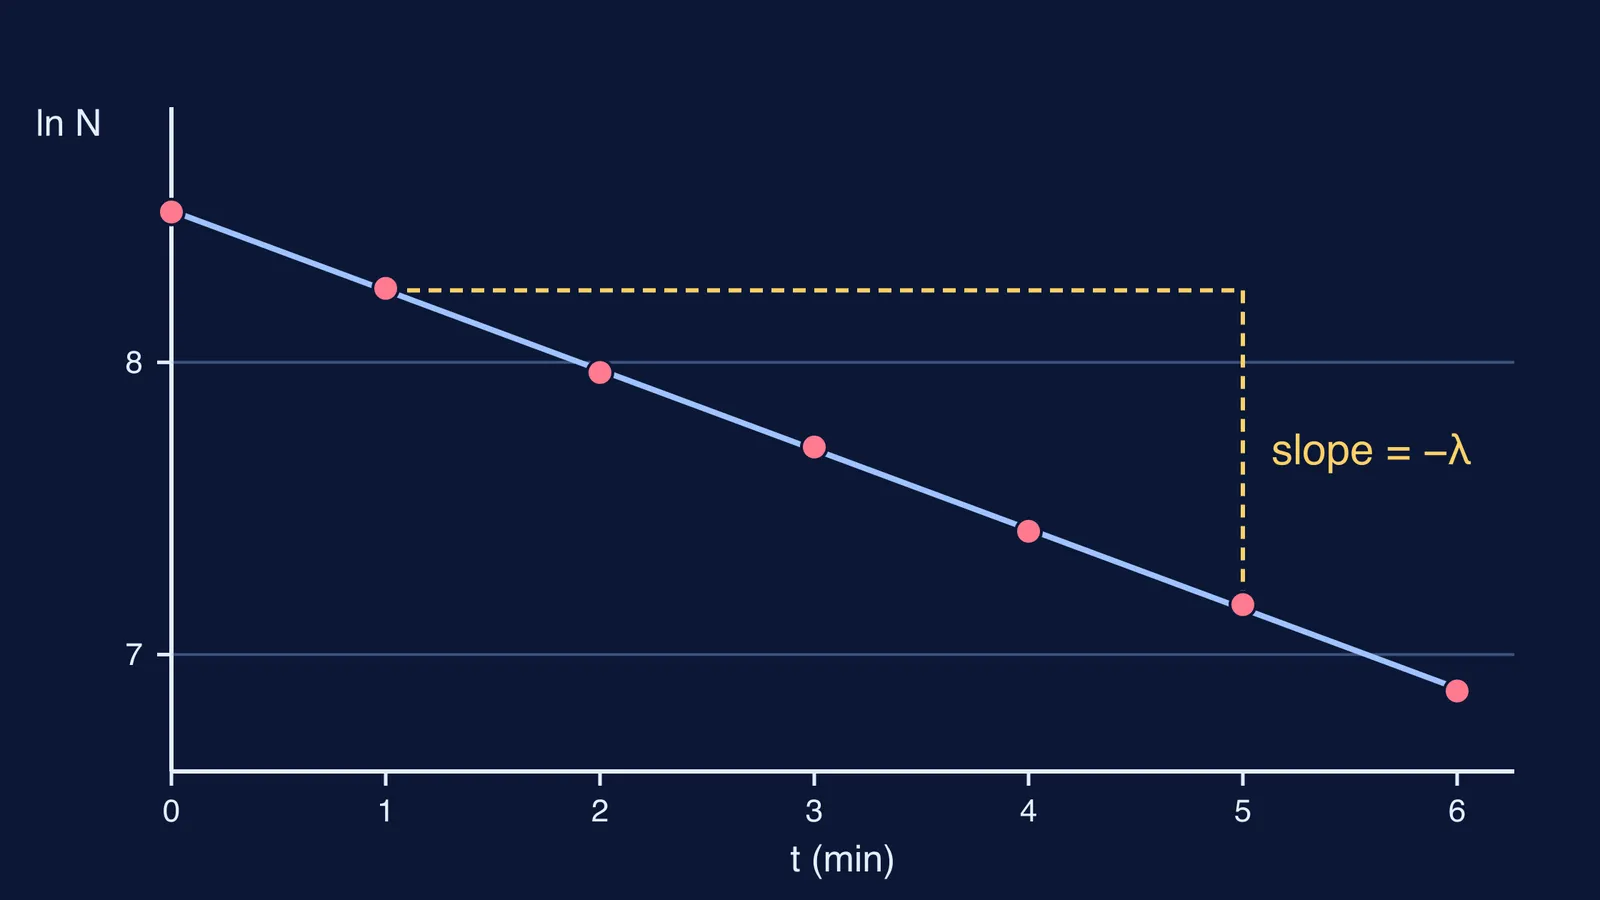
t = 0 min: 4987 counts, ln = 8.51
t = 1 min: 3842 counts, ln = 8.25
t = 2 min: 2879 counts, ln = 7.97
t = 3 min: 2231 counts, ln = 7.71
t = 4 min: 1672 counts, ln = 7.42
t = 5 min: 1301 counts, ln = 7.17
t = 6 min: 968 counts, ln = 6.88
Now follow these steps:
Plot ln(counts) on the y-axis against t in minutes on the x-axis.
Draw one best-fit straight line through the points. Don't join the dots.
Pick two points on the line, far apart. Here the line passes through about (0, 8.52) and (6, 6.88).
Slope = (6.88 − 8.52) ÷ (6 − 0) = −1.64 ÷ 6 = −0.273 per minute.
Slope = −λ, so λ = 0.273 min⁻¹.
Half-life: T½ = 0.693 ÷ λ = 0.693 ÷ 0.273 ≈ 2.54 min.
That is within 1% of LNHB's 2.5545 minutes. A least-squares fit on a calculator gives a slope of −0.272 min⁻¹, which is practically the same answer.
Check it by eye too. Half of 4987 is about 2490, and the counts pass that value between t = 2 and t = 3 minutes. A half-life of about 2.5 minutes fits.
Mean life is the reciprocal of the decay constant, and the half-life is 0.693 times the mean life (HyperPhysics, Georgia State University). Here τ = 1 ÷ 0.273 ≈ 3.66 minutes. If those two terms still blur together, our explainer on mean life vs half-life separates them.
What if the graph uses log base 10 instead of ln?
Because ln x = 2.303 log₁₀ x, the slope of a log₁₀ N vs t graph is −λ ÷ 2.303, so λ = −2.303 × slope. For the data above the log₁₀ slope is about −0.1185 per minute, and 2.303 × 0.1185 gives back 0.273 min⁻¹. Check the axis label first.
If the axis shows activity instead of N, the method is the same; our post on the ln activity vs time graph works through that version.
Which mistakes cost marks on these questions?
Keeping the minus sign. The slope is negative; λ is positive.
Using two raw data points. Their scatter goes straight into your answer. Read points off the best-fit line.
Counting grid squares. Use the values on the axes.
Dropping units. With t in minutes, λ is in min⁻¹. Divide by 60 for s⁻¹: 0.273 min⁻¹ ≈ 0.00455 s⁻¹.
Mixing up τ and T½. τ = 1/λ; T½ = 0.693/λ.
Forcing a line through a curve. A bending ln plot can mean more than one isotope, or background counts not subtracted. Say so in a lab report.
If you can set up the graph but keep slipping on signs, logs or units, the Fermi Problem Library has worked problems with a step-by-step solver that explains the reasoning rather than printing an answer. If the gap is further back, in exponentials or first-order kinetics, the Fermi Concept Library gives each concept its own lesson.
For the bigger picture of what half-life means, read our guide to radioactive decay and half-life.