On this page
A NAAC grade on a college brochure looks like a verdict. It is narrower than that. Once you know what the grade scores, you can use it for what it does well: screening out colleges with weak systems. Then you can look elsewhere for the things it leaves out.
What does a NAAC grade actually measure?
The National Assessment and Accreditation Council (NAAC) was set up in 1994 as an autonomous institution of the UGC, according to NAAC's manual for universities. It scores a whole institution on seven criteria: curricular aspects; teaching-learning and evaluation; research, innovations and extension; infrastructure and learning resources; student support and progression; governance, leadership and management; and institutional values and best practices.
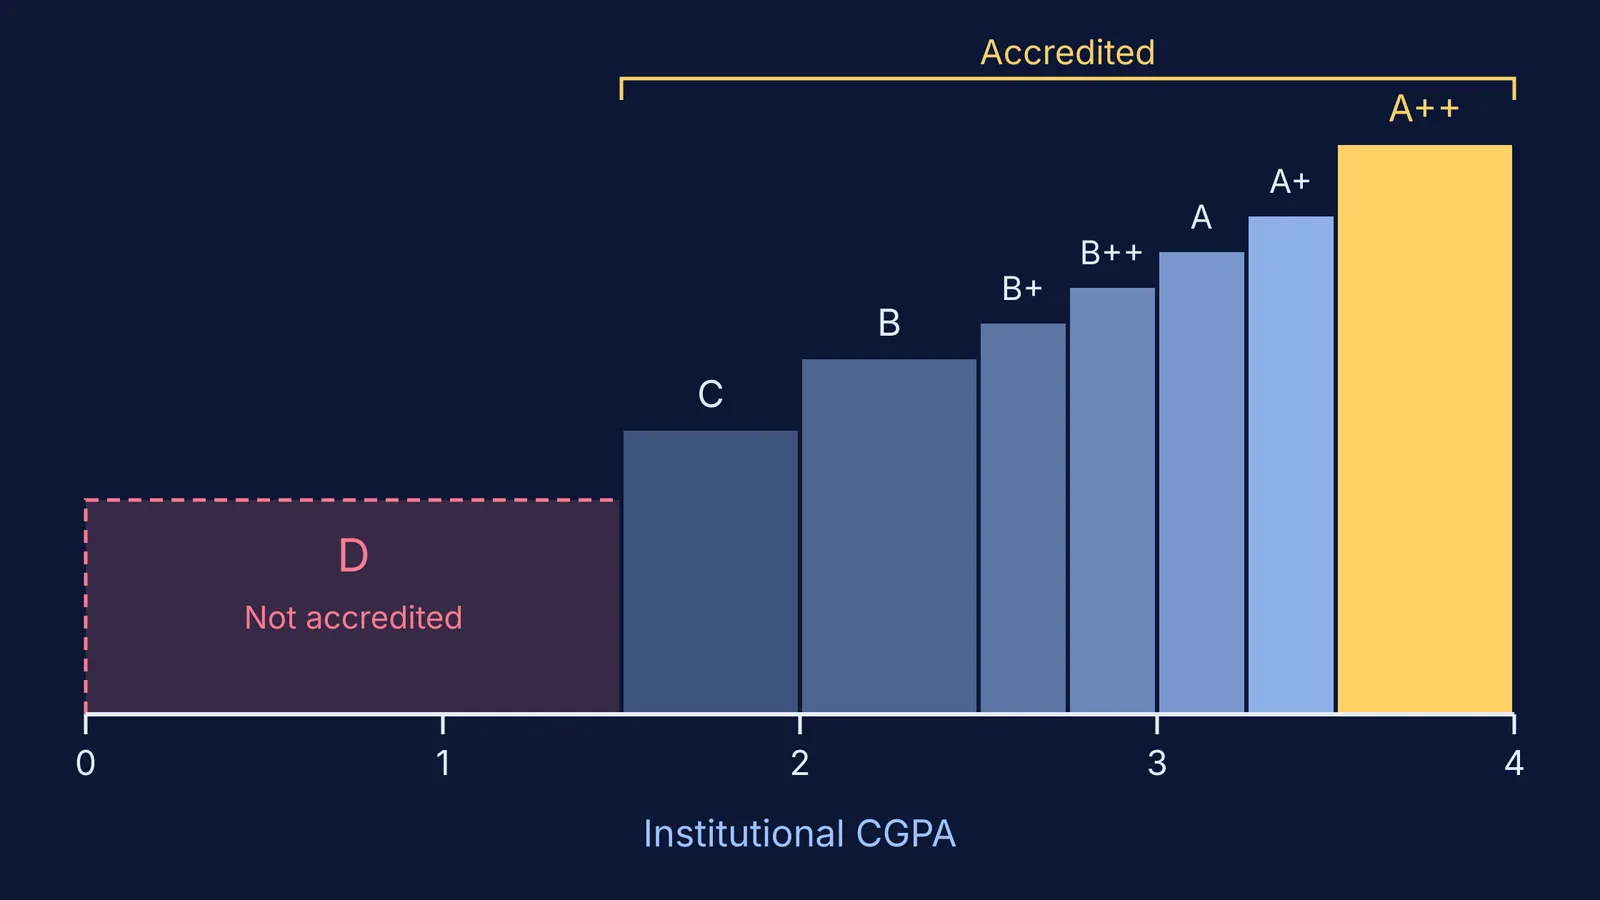
The score is built from three inputs: system-generated scores from the data the college submits, a peer team's on-site appraisal, and a student satisfaction survey. The same manual puts the mix at about 70% online evaluation of data and about 30% peer judgement. The result is a CGPA out of 4.00, which maps to a letter grade:
A++: 3.51 to 4.00
A+: 3.26 to 3.50
A: 3.01 to 3.25
B++: 2.76 to 3.00
B+: 2.51 to 2.75
B: 2.01 to 2.50
C: 1.51 to 2.00
D: 1.50 or less, which means not accredited
Every grade from C to A++ carries the status "Accredited" in NAAC's grading table.
What does a NAAC grade not tell you?
It rates the institution, not your branch. A Ministry of Education committee report notes that NAAC grades institutions over 5-year block periods, while the NBA accredits individual programmes in technical disciplines. An A+ university can still run a weak department.
It is also a snapshot. A grade awarded four years ago describes the college as it was four years ago.
A missing grade doesn't automatically mean a bad college. The same committee report found that only 9,479 of 43,796 colleges (21.64%) had been accredited by NAAC as of 30 September 2023. So many of the colleges you look at may have no grade at all. Still, ask the college why.
The scale itself is changing. In January 2024 NAAC announced a move to binary accreditation (accredited or not), followed by maturity-based levels 1 to 5. In February 2025, Careers360 reported that institutions in their second accreditation cycle or later could keep their present grades until the new system is officially launched. For a while you may see both kinds of result.
How do NAAC, NIRF and placement data fit together?
The National Institutional Ranking Framework was launched on 29 September 2015 and ranks participating institutions every year. Its five parameters are teaching, learning and resources; research and professional practice; graduation outcomes; outreach and inclusivity; and perception. NIRF also publishes the data that ranked institutions submit, which is where it gets most useful to you. For more on this, see our guide to reading NIRF data sensibly.
How can one data sheet give three placement rates?
Take IIT Madras's data sheet for India Rankings 2025. For the four-year UG batch that graduated in 2023-24, 929 students were admitted, 714 graduated in the minimum time, 549 were placed and 153 were selected for higher studies. The median salary of placed graduates was Rs 17.5 lakh a year.
549 of 714 graduates placed is 77%.
549 placed plus 153 in higher studies, out of 714, is 98%.
549 placed out of 929 admitted is 59%.
All three numbers are true. A brochure may print the biggest one. Always ask what the bottom of the fraction is. Our list of placement data red flags covers the other tricks.
How should you check a college on your shortlist?
Confirm the grade and its date. NAAC's manual makes it mandatory for institutions to display their accreditation outcome on their website. Check the cycle and when it expires.
Check the programme, not just the campus. For engineering, see whether your branch has NBA accreditation. Here's what NBA accreditation means for a branch.
Read the weaknesses. The same manual says the NAAC outcome includes an analysis of strengths, weaknesses, opportunities and challenges, plus no more than 10 recommendations. That page tells you more than the letter grade.
Do the placement maths yourself. Open the NIRF data sheet and work out all three rates, as in the example above. Look at median salary, not the highest package.
Ask people on campus. Put the same questions to the admissions office and to a current student: "How many students in my branch sat for placements last year, and how many got offers?" If the two answers don't match, trust neither until you see the data.
Once your list is settled, the work shifts back to your own preparation. If you're not sure where to start, Fermi's AI tutor can work out what you already know and build a plan for the session.