On this page
Cricket is a stream of numbers: runs, balls, wickets. If you already argue about who the better batter is, you are halfway to statistics. The other half is knowing which number answers which question.
Why learn statistics with cricket scores?
The GAISE College Report (2016), endorsed by the American Statistical Association, makes six recommendations for teaching introductory statistics. One of them is "Integrate real data with a context and purpose." Cricket gives you both, and because you know the game, you can tell when an answer makes no sense.
The Statistics chapter in NCERT's Class 11 Mathematics textbook opens with the runs two batsmen scored in their last ten matches. We use the same numbers below.
What is a batting average, and is it the same as the mean?
Not quite. In cricket, batting average is runs scored divided by the number of times the batter was out, as Wikipedia's batting average entry) explains. The school mean divides by the number of innings instead, and the gap appears with not-outs. Don Bradman scored 6,996 Test runs in 80 innings with 10 not-outs, for a Test average of 99.94, the same entry shows. That is 6,996 divided by 70 dismissals. Divide by 80 innings instead and you get 87.45 runs per innings. It also notes that Phil Tufnell scored 15 runs in 10 ODI innings but was out only once, so his ODI average is 15.
How do you calculate strike rate?
Batting strike rate is runs scored per 100 balls faced, worked out as (runs ÷ balls) × 100, according to Wikipedia's strike rate entry. Bowling strike rate turns this around: balls bowled per wicket taken, so for bowlers a lower number is better.
You can't simply average strike rates across innings. Made-up example: 40 off 20 balls (strike rate 200), then 10 off 40 balls (strike rate 25). Averaging the two gives 112.5, but the batter really scored 50 runs off 60 balls, a strike rate of 83.3. Add up runs and balls first, then divide. The same idea sits behind how net run rate works in the IPL.
How do you measure spread in cricket scores?
Here are the two batsmen from the NCERT Class 11 Statistics chapter:
Batsman A: 30, 91, 0, 64, 42, 80, 30, 5, 117, 71
Batsman B: 53, 46, 48, 50, 53, 53, 58, 60, 57, 52
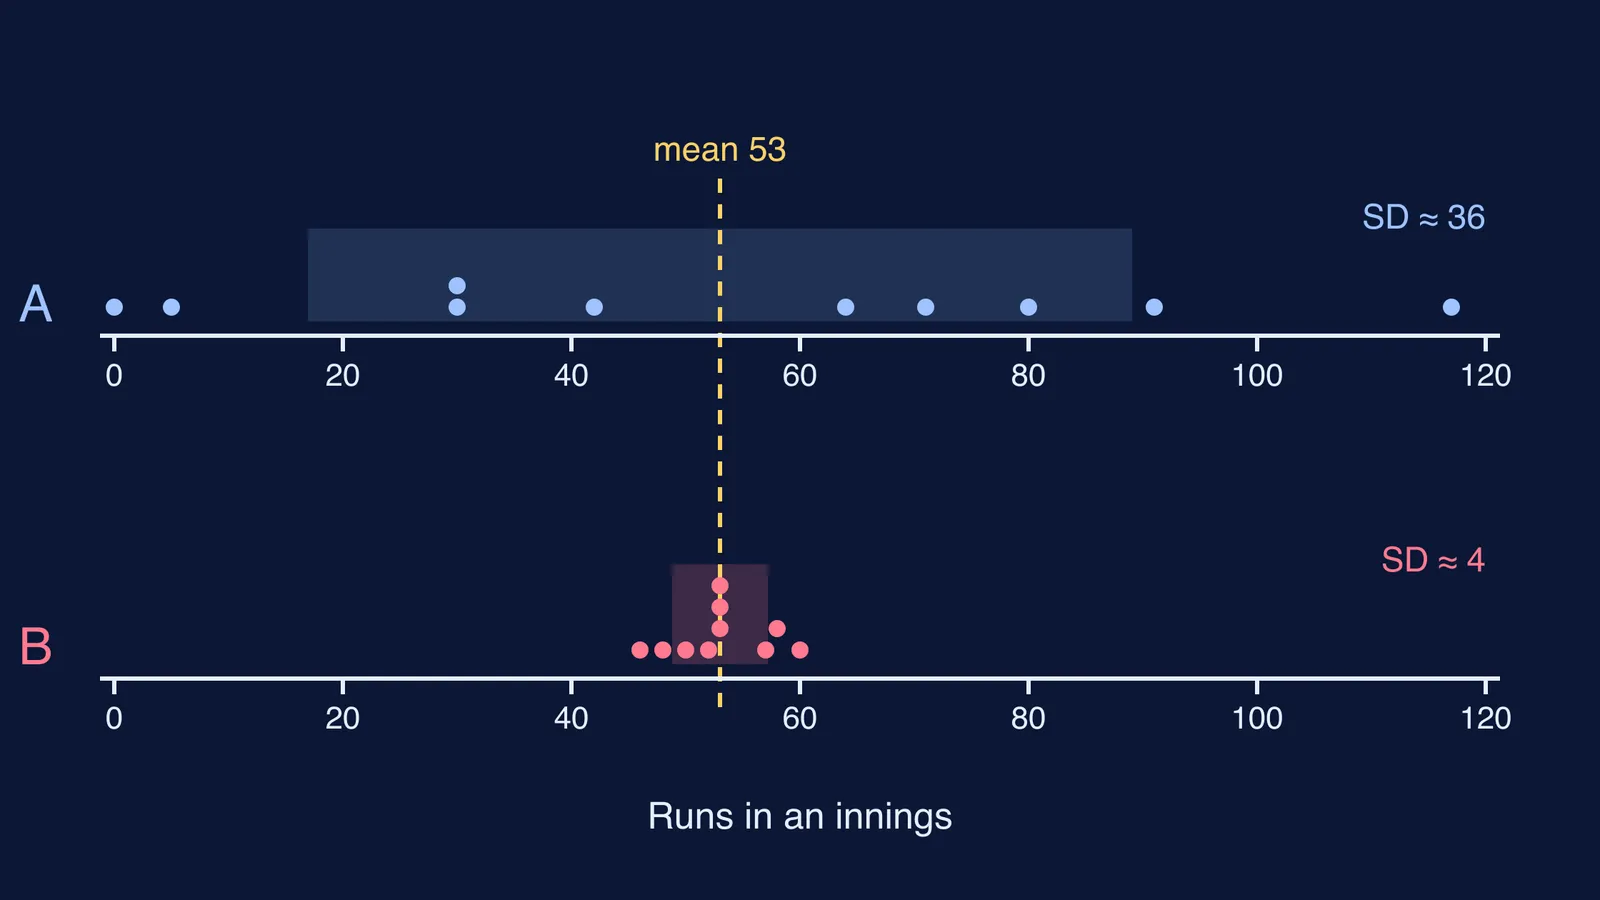
Each scored 530 runs, so both have a mean of 53, and both have a median of 53. Yet, as the textbook points out, the two performances are clearly not the same. Measures of spread show how.
Range is the highest score minus the lowest. A: 117 − 0 = 117. B: 60 − 46 = 14.
Mean deviation is the average distance from the mean, ignoring signs. A's distances from 53 add up to 316, giving 31.6. B's add up to 32, giving 3.2.
Variance is the mean of the squared distances from the mean, which is how NCERT defines it. A: 13,006 ÷ 10 = 1,300.6. B: 174 ÷ 10 = 17.4.
Standard deviation is the square root of the variance. A: about 36.1 runs. B: about 4.2 runs.
A's scores are spread widely around 53, with a standard deviation of about 36 runs, while B's stay close, at about 4. After a collapse, B's steadiness is worth a lot. Chasing a big total, A gives you more chances of a hundred, and of a duck. Statistics doesn't pick the player, but it shows the trade-off. To see why squaring makes big misses count for more, try this dot-plot walkthrough of standard deviation. To see why one 117 pulls the mean but not the median, read mean vs median with an outlier.
How can you practise this with real matches?
This works well on your own or with a parent:
Pick two batters you follow and copy their last ten scores and balls faced from a scorecard.
Mark the not-outs. Work out the cricket average (runs ÷ dismissals) and the plain mean (runs ÷ innings).
Work out each batter's overall strike rate from total runs and total balls.
Draw both dot plots on the same 0 to 120 line, like the diagram at the top of this page.
Work out range, mean deviation and standard deviation by hand for one batter; check the other with a calculator.
Write two sentences: who is more consistent, and who you would pick for a T20 chase.
Step 5 is the easiest place to slip, usually by not squaring the distances or not dividing by the number of innings. If variance still feels shaky, the Fermi Concept Library has a lesson for every concept in mathematics, each with its place in the map, so you can go back to the idea it builds on.
Next match, keep a notebook beside you. Ten innings is enough to start.