On this page
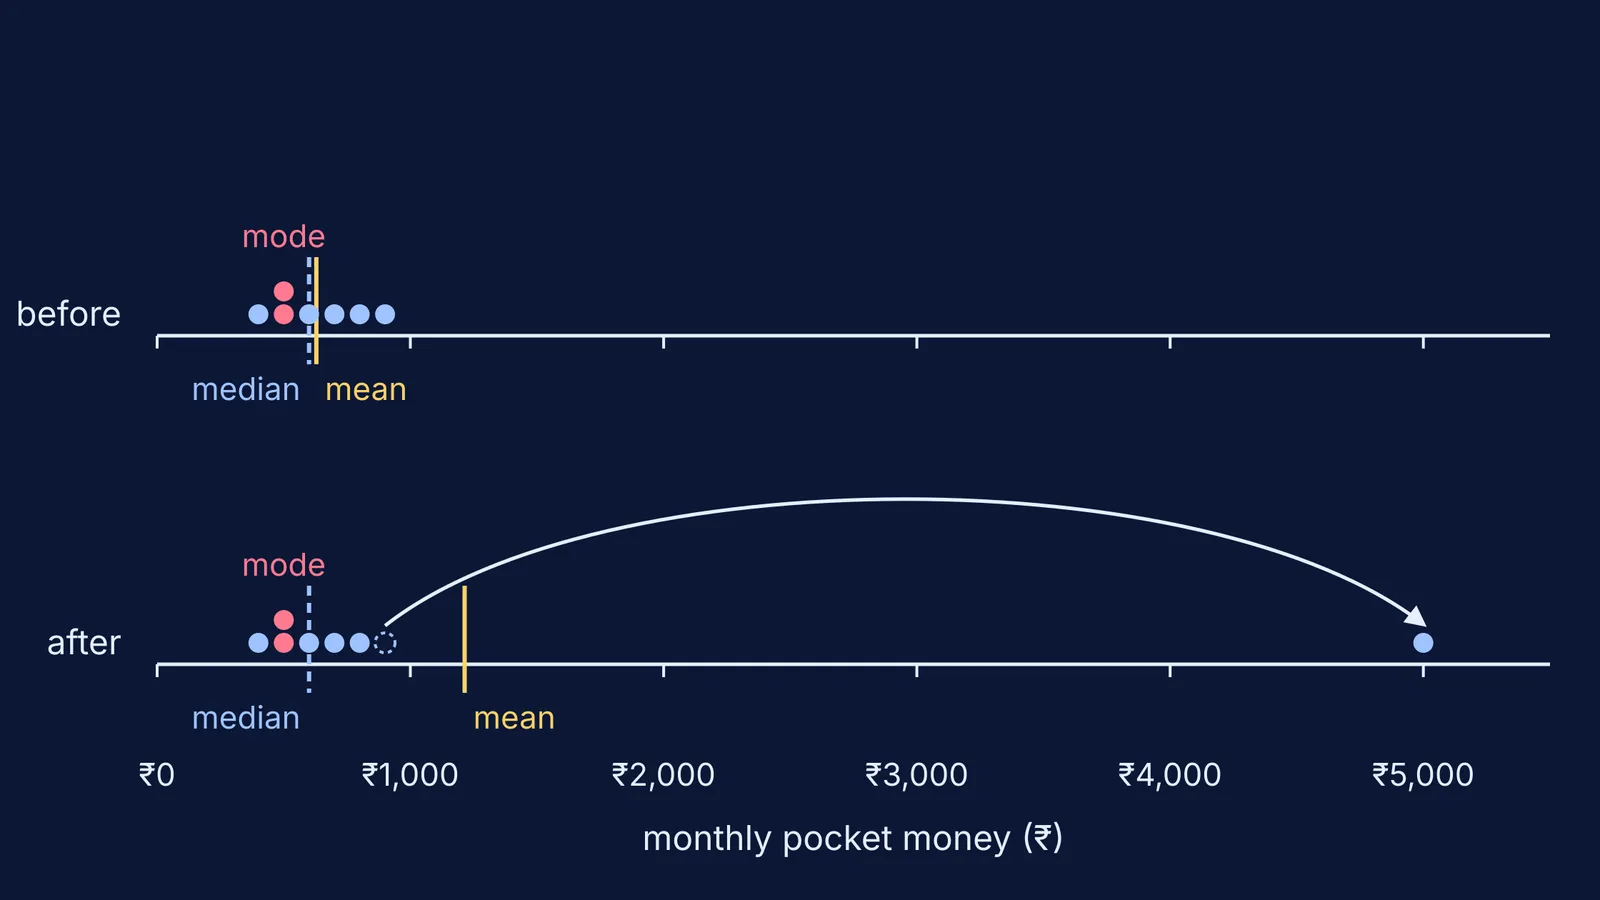
Imagine seven friends comparing their monthly pocket money: ₹400, ₹500, ₹500, ₹600, ₹700, ₹800 and ₹900. Now one friend's dot gets dragged far to the right, to ₹5,000. Before you read on, guess: does the mean move a lot, a little or not at all? What about the median, and the mode? Write your three guesses down.
Why predict before you drag the point?
In a 2004 study, physics education researchers Catherine Crouch, Eric Mazur and colleagues found that students who passively watched a classroom demonstration understood the idea no better than students who did not see it at all, while students who predicted the outcome first showed significantly greater understanding (American Journal of Physics, 2004). A dot plot you can drag is a demonstration you run yourself, so the same rule applies: guess, then look, then explain any surprise. More on this habit in predict first, then test with a simulation.
What happens to the mean when one point moves far away?
First, the three averages, as defined in the US National Institute of Standards and Technology handbook of statistical methods:
The mean is the sum of the data points divided by the number of data points.
The median is the value that has half the data smaller than it and half the data larger.
The mode is the value that occurs most often.
Before the drag, the seven amounts add up to ₹4,400, so the mean is ₹4,400 ÷ 7, about ₹629. The median is the fourth value in order, ₹600. The mode is ₹500, the only amount that appears twice.
Now drag ₹900 out to ₹5,000. The total rises by ₹4,100 to ₹8,500, so the mean becomes ₹8,500 ÷ 7, about ₹1,214. It has nearly doubled, and six of the seven friends now get less than the "average". The median is still ₹600; the mode is still ₹500.
The rule behind it: moving one of n points by a distance d always shifts the mean by exactly d ÷ n. If every value changes rather than just one, see what happens to the mean when you add or multiply every value.
Why does the median barely move?
The NIST handbook gives the reason in one line: "Extreme values in the tails distort the mean. However, these extreme values do not distort the median since the median is based on ranks" (NIST, measures of location).
The median only cares about order. Dragging ₹900 further right does not change who sits in the middle. Start again and drag the ₹400 dot to ₹5,000. The order becomes ₹500, ₹500, ₹600, ₹700, ₹800, ₹900, ₹5,000, and the median steps up to ₹700, one neighbour along. Drag it to ₹5 lakh and the median is still ₹700. One point can nudge the median to the next value in line, but it can never pull the median out to itself. With an even number of values the median is the mean of the middle two; here is how to find the median with an even number of observations.
When does the mode change?
The mode ignores distance completely and only counts repeats, so it changes only when a drag creates or breaks a tie. Drag one of the two ₹500 dots to ₹5,000 and no amount repeats, so this data set has no mode at all. Drag ₹800 onto ₹700 instead and ₹500 and ₹700 tie, giving two modes. It is most useful for categories: the most common shoe size, or the most popular stream choice after Class 10.
Mean, median or mode: which average should you use?
Ask what question the average has to answer:
Do you need the total? Use the mean. Mean × count gives back the total, so it suits splitting a bill or working out cost per head.
Do you want a typical value, and could a few values be very large or very small? Use the median. NIST notes that for data with extreme values in the tails, the median generally estimates location better than the mean (NIST handbook). Think incomes, flat prices or commute times.
Do you want the most common category? Use the mode.
Not sure? Report the mean and the median together. A big gap is a signal in itself: NIST notes the mean is pulled in the direction of the skew, towards the heavier tail.
First check: is the outlier real? A ₹5,000 that should have been ₹500 is a typing error to fix, not a reason to switch averages.
Ideas like this are easier to see than to read, which is what the Fermi Simulation Lab is for: interactive simulations you can try for yourself after making your guess. If a result surprises you, Fermi's AI tutor can draw the figure, run the simulation and check your understanding as it goes.
Make your three predictions, drag the dot, and see which average you trusted too much.