On this page
Most charts in school projects go wrong in one of three ways: the wrong type of chart, axes without labels or units, or a scale that makes a small difference look huge. All three are quick to fix.
Which chart should you use for your project data?
Start from the question your data answers, not from the chart menu in your spreadsheet.
Comparing amounts across groups (marks by section, votes for each option): bar chart.
Showing change over time (temperature each day, a plant's height each week): line graph, with time on the x-axis.
Showing how one measurement depends on another (pendulum length and time period): scatter plot, with the thing you changed on the x-axis.
Showing how values are spread out (heights of your classmates in ranges): histogram, with no gaps between the bars.
Showing parts of one whole: pie chart, and only with a few slices.
William Cleveland and Robert McGill, statisticians at AT&T Bell Laboratories, proposed and partly tested an order for how accurately people make the judgements involved in reading graphs: position along a common scale first, then position on separate but identical scales, then length, direction and angle, then area, then volume and curvature, then shading and colour saturation (Journal of the American Statistical Association, 1984). A bar chart asks the reader to compare positions on one scale; a pie chart asks them to compare angles. That is why bars usually beat a pie when two slices are close in size, and why 3D bars and bubbles tend to make reading harder, not easier.
For a longer side-by-side of each type, see our guide on choosing between a bar, line, pie or histogram.
How do you label the axes on a graph?
Every axis label should say what was measured and in what unit: "Time (s)", not "Time"; "Marks (out of 80)", not "Marks". Then check:
A title that says what the chart shows, such as "Literacy rate in India by census year".
Both axes labelled, with units in brackets.
Evenly spaced tick marks, unless you chose a log scale and said so.
A legend if there is more than one set of data.
A source line under the chart saying where the numbers came from, even if it is "Our survey of Class 9B".
Survey numbers need tidying before you plot; our guide to cleaning survey data for a school project walks through it.
Why should a bar chart start at zero?
The length of a bar is the number. If the axis starts at 60 instead of 0, the bar shows only the part above 60, and readers compare those leftover pieces.
In a study by Anshul Vikram Pandey and colleagues at New York University, online participants saw the same bar-chart data with either a full axis or a truncated one, then rated how much bigger one quantity was on a 1-to-5 scale (CHI 2015 paper). The average rating was 2.77 for the truncated chart and 1.45 for the full one. A 2020 study by Michael Correll, Enrico Bertini and Steven Franconeri found the exaggeration persisted even when the chart carried visual cues that the axis had been cut (Truncating the Y-Axis: Threat or Menace?). For other chart types, the authors note, truncation can help or harm depending on what you want to show.
Worked example: the same numbers, two stories
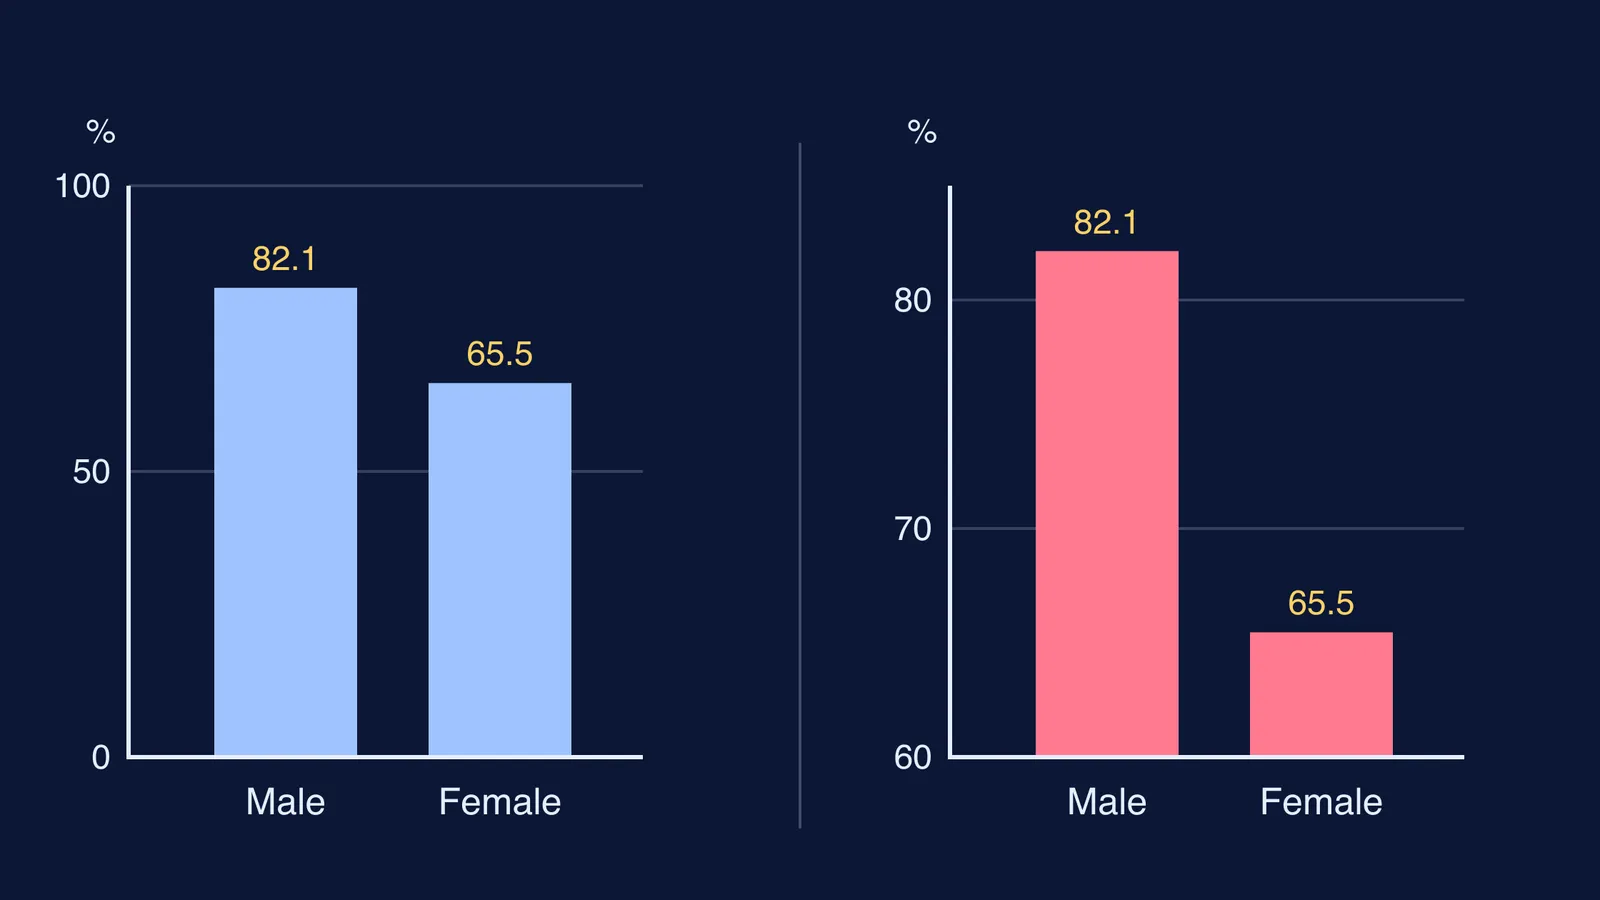
In Census 2011, India's literacy rate was 82.14% for males and 65.46% for females, according to the Ministry of Statistics and Programme Implementation (MoSPI, Women and Men in India, Table 3.1).
Drawn from zero, the male bar is 82.14 ÷ 65.46, about 1.25 times the height of the female bar, as the data say.
Drawn from an axis that starts at 60, the bars show 22.14 and 5.46, so the male bar looks about 4 times as tall.
If you are comparing two groups in one year, use bars from zero. If you are showing how the gap changed, draw two lines across the census years from 1951 to 2011 on the same axes; the same table shows female literacy rising from 8.86% to 65.46% over that period. Read the table's notes too: rates up to 1971 count people aged 5 and above, and later ones people aged 7 and above. Put that in your source line.
What should you check before you submit?
Can you say the chart's message in one sentence?
Does the chart type fit the question?
Are both axes labelled with units?
Do the bars start at zero?
Have you removed 3D effects, shadows and extra colours?
If the maths behind a chart is the shaky part, the Fermi Concept Library has a lesson for every concept in mathematics, each with its place in the map. When your charts are ready, our guide to making a research poster shows how to lay them out.