
On this page
Every map on your phone started as numbers: a surveyor's angle and distance readings, a satellite image, a GPS track. Cartography turns those numbers into a map people can trust. If you like geography, maths and computers equally, it is worth a look, and India has two clear ways in.
What does a cartographer actually do?
The US Bureau of Labor Statistics says cartographers and photogrammetrists "collect, analyze, and interpret geographic information to create and update maps and related products." The same profile says they use GIS and CAD software, gather measurements from sources such as LiDAR, and prepare static or interactive maps in print or digital form.
A GIS (geographic information system) is software that stores data together with its location, so you can stack roads, rivers, census figures and elevation on one map and ask it questions. Much of the field data that feeds it is collected by surveying and mapping technicians, who operate survey instruments and process what they record.
How does a survey reading become a map point?
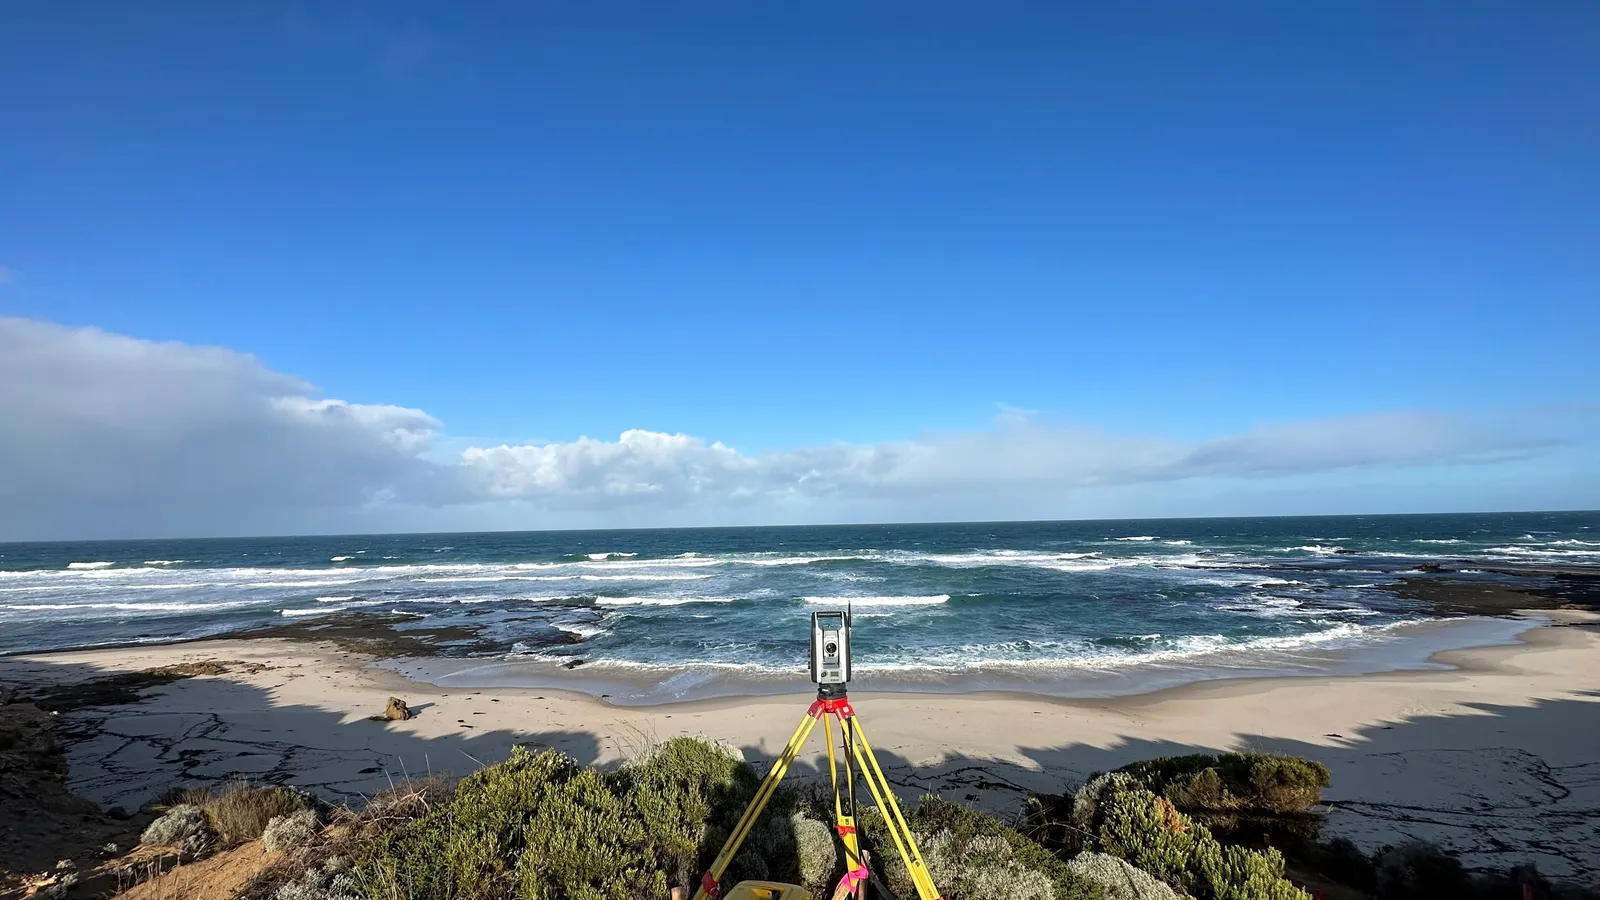
Say a surveyor sets up a total station at a known point. It measures a boundary stone 120 m away on a bearing of 30 degrees, counted clockwise from north. To put the stone on the map, you split that reading into two parts:
East offset = 120 × sin 30° = 60 m
North offset = 120 × cos 30° ≈ 103.9 m
On a 1:5,000 map, 60 m becomes 1.2 cm and 103.9 m becomes about 2.08 cm
That is school trigonometry plus a scale ratio. GIS software does this for thousands of points, but you still have to spot a wrong number. If scale conversions trip you up, our guide to solving map scale ratio problems walks through them, and the Fermi Problem Library has worked problems with a step-by-step solver that explains the reasoning rather than printing an answer.
Geography or engineering: which route into mapmaking?
Both work, and lead to slightly different jobs.
The geography route. Take geography in Class 11 and 12 if your school offers it, then a BA or BSc in geography, then a master's in geoinformatics, remote sensing or GIS. The BLS profile lists a bachelor's degree in cartography, geography, geomatics or surveying as the usual entry point. It suits you if cities, climate or disaster mapping pull you in. Your Class 11 geography practicals are a first taste of the work.
The engineering route. Take PCM, clear an entrance exam and study civil engineering, where surveying is a core subject. This route suits you if you like instruments, construction and precise measurement. It also opens a government door: the Engineering Services Examination Rules, 2021 list the Survey of India Group 'A' Service under Category I, Civil Engineering. The list of services is set afresh each year, so check UPSC's current notice before you plan around it. Our post on civil engineering career paths covers the rest of that branch.
Either route can lead to postgraduate study at the Indian Institute of Remote Sensing in Dehradun, which ISRO describes as an institute for capacity building in remote sensing and geo-informatics, with courses that run from one week to two years. Admission rules change, so read the current IIRS notice.
Is there demand for cartography and GIS jobs?
The BLS counted 14,700 cartographer and photogrammetrist jobs in the US in 2025, with a 2025 median pay of $81,390 a year and growth of 7% projected from 2025 to 2035 (BLS). These are US figures, so treat them as a sign of direction, not a salary promise for India.
In India, the government notified the National Geospatial Policy, 2022 in December 2022. It builds on 2021 guidelines that deregulated how geospatial data is acquired and produced, and it aims to grow geospatial infrastructure, skills and businesses. The Survey of India, established in 1767 and now under the Department of Science and Technology, remains the national survey and mapping organisation.
How can you test cartography before choosing a degree?
Four weekends will tell you whether you enjoy the work:
Weekend 1: Install QGIS, free and open-source GIS software for Windows, Mac and Linux. Load a map of your district and change how it is styled.
Weekend 2: Walk your school campus or colony with a phone GPS app, record 10 points and plot them as a layer.
Weekend 3: Add a second layer, such as trees, streetlights or water taps, and make a map that answers one question, like which lanes have no streetlight.
Weekend 4: Show the map to a parent or teacher. Can they read it without your help? Fix whatever confused them.
If weekend 3 was your favourite, lean towards geography and GIS analysis. If weekend 2 was the fun part, look harder at surveying and civil engineering. If bearings and coordinates felt shaky along the way, the Fermi Concept Library gives every concept in mathematics and physics its own lesson.
Start with weekend 1 this Saturday.