

On this page
The CBSE Class 11 geography practical exam is worth 30 marks, comprising a 25-mark written test and 5 marks for your practical file and viva voce. [[1]](https://cbseacademic.nic.in/web_material/CurriculumMain25/SrSecondary/Geography_SrSec_2024-25.pdf) It tests your ability to read maps, convert scales, and understand how the Earth's three-dimensional surface translates to a two-dimensional sheet of paper.
This guide walks you through the syllabus, what examiners look for in your practical file, and how to read topographical maps (topo sheets) confidently.
What is the marks weightage for the Class 11 geography practical?
According to the latest CBSE guidelines, the 30-mark practical assessment is split into three parts [[1]](https://cbseacademic.nic.in/web_material/CurriculumMain25/SrSecondary/Geography_SrSec_2024-25.pdf):
Written Test: 25 marks. This covers the core syllabus chapters.
Practical File: 3 marks. A handwritten record of your exercises.
Viva Voce: 2 marks. An oral examination based on your file and the syllabus.
The written test draws from six chapters. The highest weightage goes to Introduction to Remote Sensing (6 marks), while Map Scale, Latitude, Longitude and Time, Map Projections, and Topographical Maps carry 4 marks each. The Introduction to Maps chapter carries 3 marks. [[1]](https://cbseacademic.nic.in/web_material/CurriculumMain25/SrSecondary/Geography_SrSec_2024-25.pdf)
How do you make a geography practical file?
Your practical file is proof that you have completed the required coursework. While it only carries 3 marks directly, a neat and complete file sets a strong impression for the viva voce.
Keep it handwritten: All text must be in your own handwriting. Printed notes pasted into the file will often lose you marks.
Draw precise diagrams: Use a sharp pencil and a ruler for all map scales, projections, and grid lines. Do not use pens for diagrams.
Include mandatory pages: Start with a cover page, an index (with dates and teacher signatures), and an acknowledgment section.
Follow the sequence: Present your work chapter by chapter. Start with the basics of map reading and scale conversions before moving on to complex map projections and topo sheet interpretations.
What are map scales and projections?
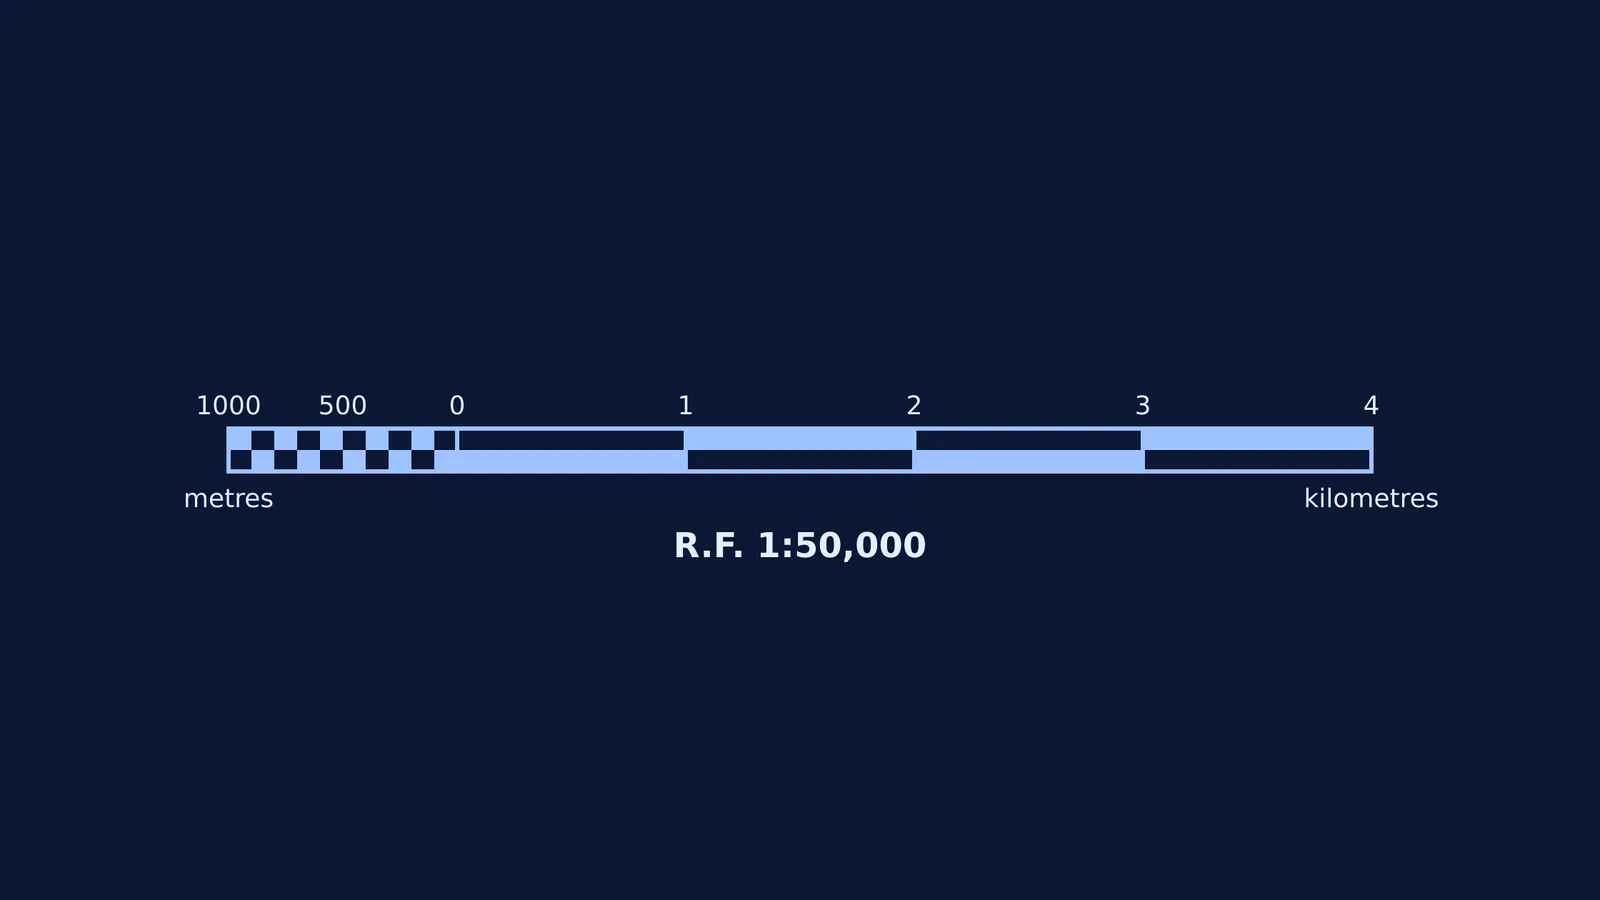
A map scale is the ratio between the distance on a map and the actual distance on the ground. [[2]](https://ncert.nic.in/textbook/pdf/kegy302.pdf) Without a scale, a drawing is just a sketch, not a map. You must be able to convert between the three types of scales:
Statement of Scale: A written sentence, such as "1 cm represents 10 km".
Representative Fraction (R.F.): A ratio where the numerator is always 1 (e.g., 1:50,000). The smaller the denominator, the larger the scale and the more detail the map shows.
Graphical Scale: A drawn bar divided into primary and secondary units, which stays accurate even if the map is photocopied to a different size.
Map projections are ways to flatten the spherical Earth onto paper. The syllabus covers Cylindrical Equal-Area, Mercator’s, and Conical projections. Each projection distorts either shape, area, or direction, so you need to know which projection suits which purpose. If you struggle to visualise how a cylinder or cone wraps around the globe to create these projections, the Fermi Simulation Lab has interactive simulations for the ideas that are easier to see than to read.
How do you read a topographical map (topo sheet)?
Topographical maps use standard conventional signs and contour lines to show the relief and land use of a small area. [[3]](https://ncert.nic.in/textbook/pdf/kegy305.pdf) Reading them quickly is a core skill for the written test and the viva.
Reading contour lines
Contour lines connect points of equal elevation above sea level. The spacing between them tells you about the shape of the land:
Closely spaced lines: A steep slope.
Widely spaced lines: A gentle slope.
Merging lines: A vertical drop, such as a cliff or waterfall.
V-shapes: A river valley (if the V points uphill) or a ridge (if it points downhill).
Reading conventional colours
Survey of India topo sheets use a standard colour code [[3]](https://ncert.nic.in/textbook/pdf/kegy305.pdf):
Yellow: Cultivated land used for farming.
Green: Forested areas and orchards.
White: Barren, uncultivated, or rocky land.
Blue: Water bodies (like perennial rivers and wells).
Brown: Contour lines and sand dunes.
Red: Man-made features like settlements, roads, and grid lines.
Black: Railway lines, boundaries, and dry river beds.
What is remote sensing in the geography practical?
The chapter with the highest weightage in the written test is Introduction to Remote Sensing. You will need to understand how satellites and aircraft capture data about the Earth's surface without physical contact.
Key concepts to learn include the difference between active sensors (like radar) and passive sensors (like cameras), and how to visually identify features like forests, water, and cities from satellite imagery based on their tone, texture, and shape.
How do you prepare for the geography viva voce?
The viva voce tests whether you actually understand the work in your file and is worth 2 marks. Examiners usually ask foundational questions.
Know your definitions: Be ready to define cartography, contour interval, and remote sensing clearly.
Explain your diagrams: If you drew a conical projection, be prepared to explain why it is used and which parts of the Earth it shows best.
Interpret on the spot: The examiner may open a topo sheet and ask you to identify the settlement pattern (e.g., nucleated or scattered) or the direction a river is flowing based on spot heights.
If you find yourself overwhelmed and not knowing where to start your revision, Fermi's AI tutor works out what you already know, builds a plan for the session, and teaches through it to help you prepare effectively.
By keeping your file updated and practising your scale conversions and map reading, you can walk into the practical exam with confidence.


