On this page
Mendel's 3:1 ratio is the number you meet first in genetics class, and it is easy to misread. Cross two pea plants that each carry one dominant and one recessive allele (Aa × Aa), and each offspring has a 3 in 4 chance of showing the dominant trait. Here you make a prediction, then test it with 10, 100 and 1,000 offspring.
Why doesn't a small cross give exactly 3:1?
Each offspring is a separate draw. In an Aa × Aa cross, the four equally likely combinations are AA, Aa, aA and aa, so three of the four show the dominant trait. If you want a refresher on multiplying and adding those chances, our post on the product rule and sum rule in genetics works through it.
Because each draw is independent, a run of recessive offspring is no more "due" to stop than a run of tails. With 10 offspring the expected count is 7.5 dominant, which no real batch can have. The closest you can get is 7:3 or 8:2.
What did Mendel's own pea counts show?
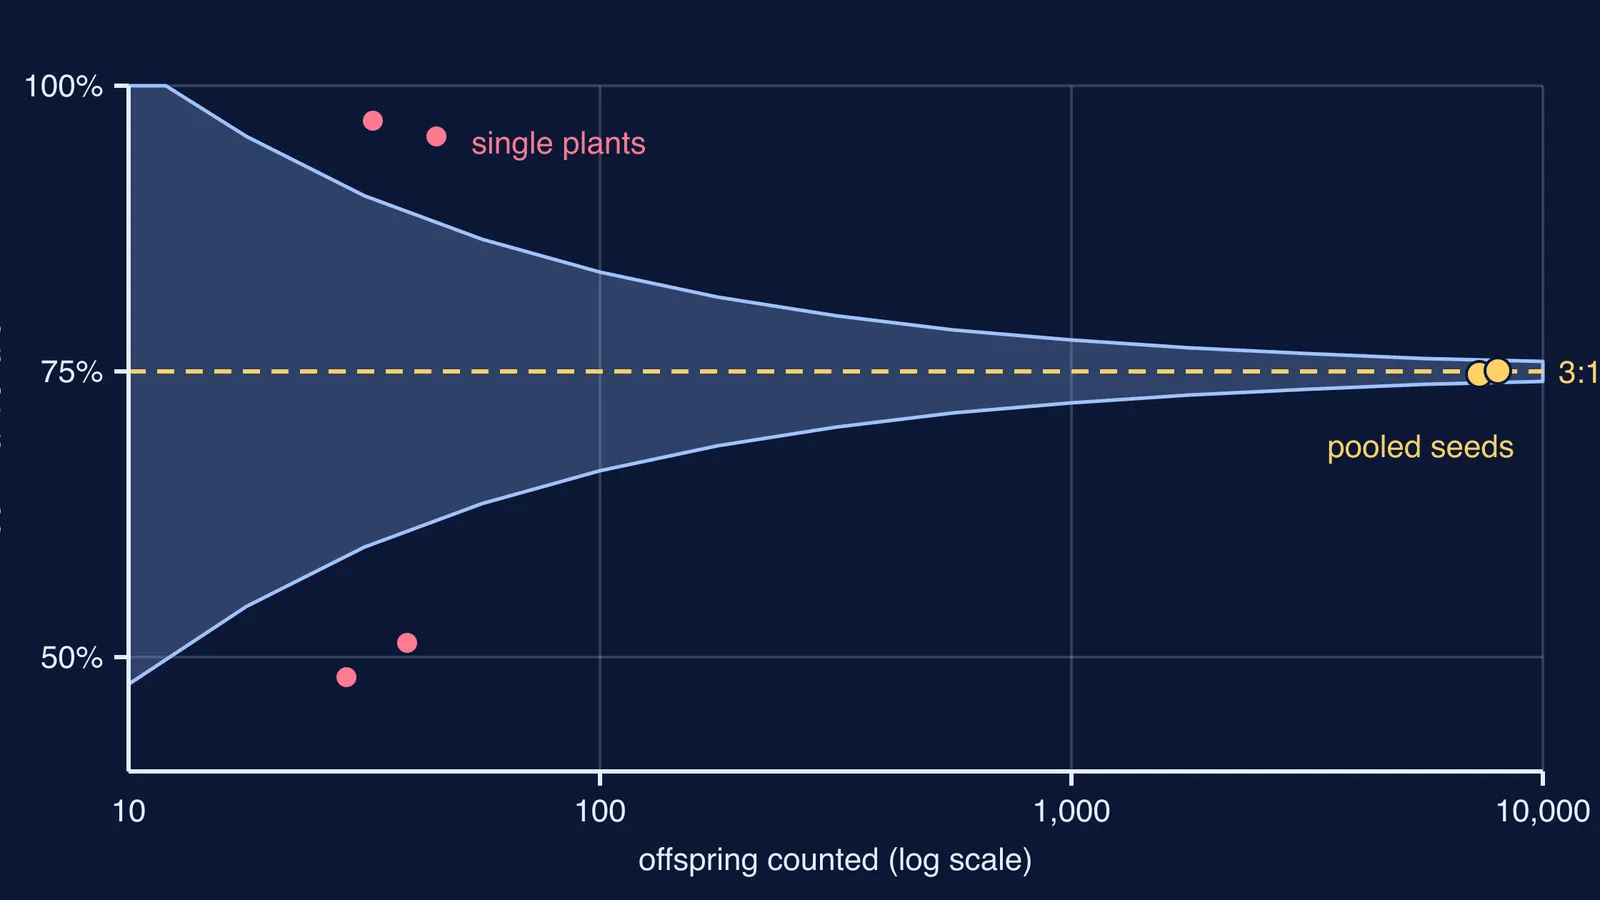
In the English translation of his paper by Scott Abbott and Daniel Fairbanks, published in Genetics in 2016, Mendel reports that 253 hybrid plants gave 7,324 seeds: 5,474 round and 1,850 wrinkled, a ratio of 2.96:1. A second experiment gave 6,022 yellow and 2,001 green seeds, a ratio of 3.01:1, and his average across all experiments was 2.98:1.
Single plants were far noisier. One plant gave 43 round seeds and only 2 wrinkled; another gave 14 round and 15 wrinkled. For seed colour, one plant gave 32 yellow and 1 green, another 20 yellow and 19 green (Abbott and Fairbanks translation).
Mendel's own explanation reads like a statistics lesson: "The true numerical ratios can be derived only as the mean from the sum of the largest possible number of individual values; the larger their number is, the more mere chance effects are eliminated" (Genetics translation).
How close will 10, 100 and 1,000 offspring get to 3:1?
Before reading on, write down your guess: out of 10 offspring, how often will you get 7 or 8 dominant? And out of 1,000, how often will you land between 700 and 800?
The probability of x dominant offspring out of n is C(n, x) × 0.75^x × 0.25^(n−x), and the standard deviation of the count is √(n × p × (1 − p)), as set out in the NIST/SEMATECH e-Handbook of Statistical Methods. We worked these out for p = 0.75:
10 offspring: the chance of exactly 8 dominant is about 28%, and of 7 or 8 together about 53%. The dominant share typically swings about 14 percentage points either side of 75%. About 2% of the time you get 4 or fewer dominant, which looks nearer 1:1 than 3:1.
100 offspring: the swing shrinks to about 4 points. Roughly 80% of runs land between 70 and 80 dominant, a ratio between 2.3:1 and 4:1.
1,000 offspring: the swing is about 1.4 points, and more than 99.9% of runs land between 700 and 800 dominant.
Ten times as many offspring cuts the swing by a factor of about 3.2, the square root of 10. That is why Mendel's 7,324 seeds landed within a hair of 3:1 while his single plants did not. Our post on 10,000 coin tosses and the law of large numbers shows the same settling with a fair coin.
How can you simulate a 3:1 cross at home?
You do not need a garden. Two coins model two Aa parents: heads means that parent passes on A, tails means a.
Write your prediction for 10 offspring: how many dominant, and how far from 7.5 you expect to be.
Toss both coins 10 times. If at least one coin shows heads, record a dominant offspring; two tails is recessive.
Compare with your prediction. Then pool results with friends or family until you have 100 offspring.
For 1,000, use a spreadsheet: in cell A1 type =IF(RAND()<0.75,1,0), fill it down to row 1,000, and sum the column. Recalculate a few times and watch how little the total moves compared with your 10-toss runs.
Write one sentence on what changed between 10, 100 and 1,000.
The same caution applies to human families, which are small samples. Two carrier parents can have three children with albinism or none, as our post on why two carriers have a 1 in 4 chance explains.
Where can you see sample size at work?
Fermi's Simulation Lab has interactive simulations for the ideas that are easier to see than to read. Fermi's AI tutor can run a simulation, draw the figure and check your understanding as it goes, so if your 10-toss result looks wrong, you can talk through why.
Make your prediction, toss the coins, and let the numbers show you how big a sample has to be.