On this page
When a planet passes between its star and a telescope, it blocks a sliver of starlight. NASA's Kepler and TESS telescopes record that light for huge numbers of stars, and AI now does much of the sorting, flagging which dips look like planets. Here is how it works, why it gets fooled, and how you can search real data yourself.
How is AI used to find exoplanets?
A light curve is a record of a star's brightness measured again and again over time. NASA explains that a planet's size can be worked out from how much the star dims, and its orbit from how long the planet takes to come round again (NASA: What's a transit?).
The hard part is deciding which repeating dips are planets. In a 2018 paper, Christopher Shallue of Google and astronomer Andrew Vanderburg trained a convolutional neural network to make that call (Shallue and Vanderburg, The Astronomical Journal). Their labelled training set held 3,600 planet candidates, 9,596 astrophysical false positives and 2,541 signals that were not transits at all (full paper on arXiv).
The network looks at each signal twice: a global view of the whole orbit, folded so every transit lines up, and a local view zoomed in on the dip itself (arXiv). On its test set it ranked plausible planet signals above false positives 98.8% of the time. Run on 670 Kepler stars already known to have more than one candidate, it led to Kepler-90i, which circles its star every 14.4 days and gave Kepler-90 eight known planets, as many as our Sun (NASA, December 2017).
A later classifier, ExoMiner, built to mimic how experts examine diagnostic tests on a signal, was used to validate 301 new planets from the Kepler archive (Valizadegan et al., The Astrophysical Journal, 2022). The NASA Exoplanet Archive listed 6,451 confirmed planets on 15 October 2026 (NASA Exoplanet Archive).
How small is the dip a planet makes?
The fraction of light blocked is roughly the planet's disk area divided by the star's disk area, which is (planet radius ÷ star radius) squared. NASA's fact sheets give mean radii of 695,700 km for the Sun (Sun fact sheet), 6,371 km for Earth (Earth fact sheet) and 69,911 km for Jupiter (Jupiter fact sheet).
Earth: 6,371 ÷ 695,700 = 0.00916. Squared, that is 0.000084, a dip of about 0.0084%, or 84 parts per million.
Jupiter: 69,911 ÷ 695,700 = 0.1005. Squared, that is 0.0101, a dip of about 1%, around 120 times Earth's.
Why do false alarms happen?
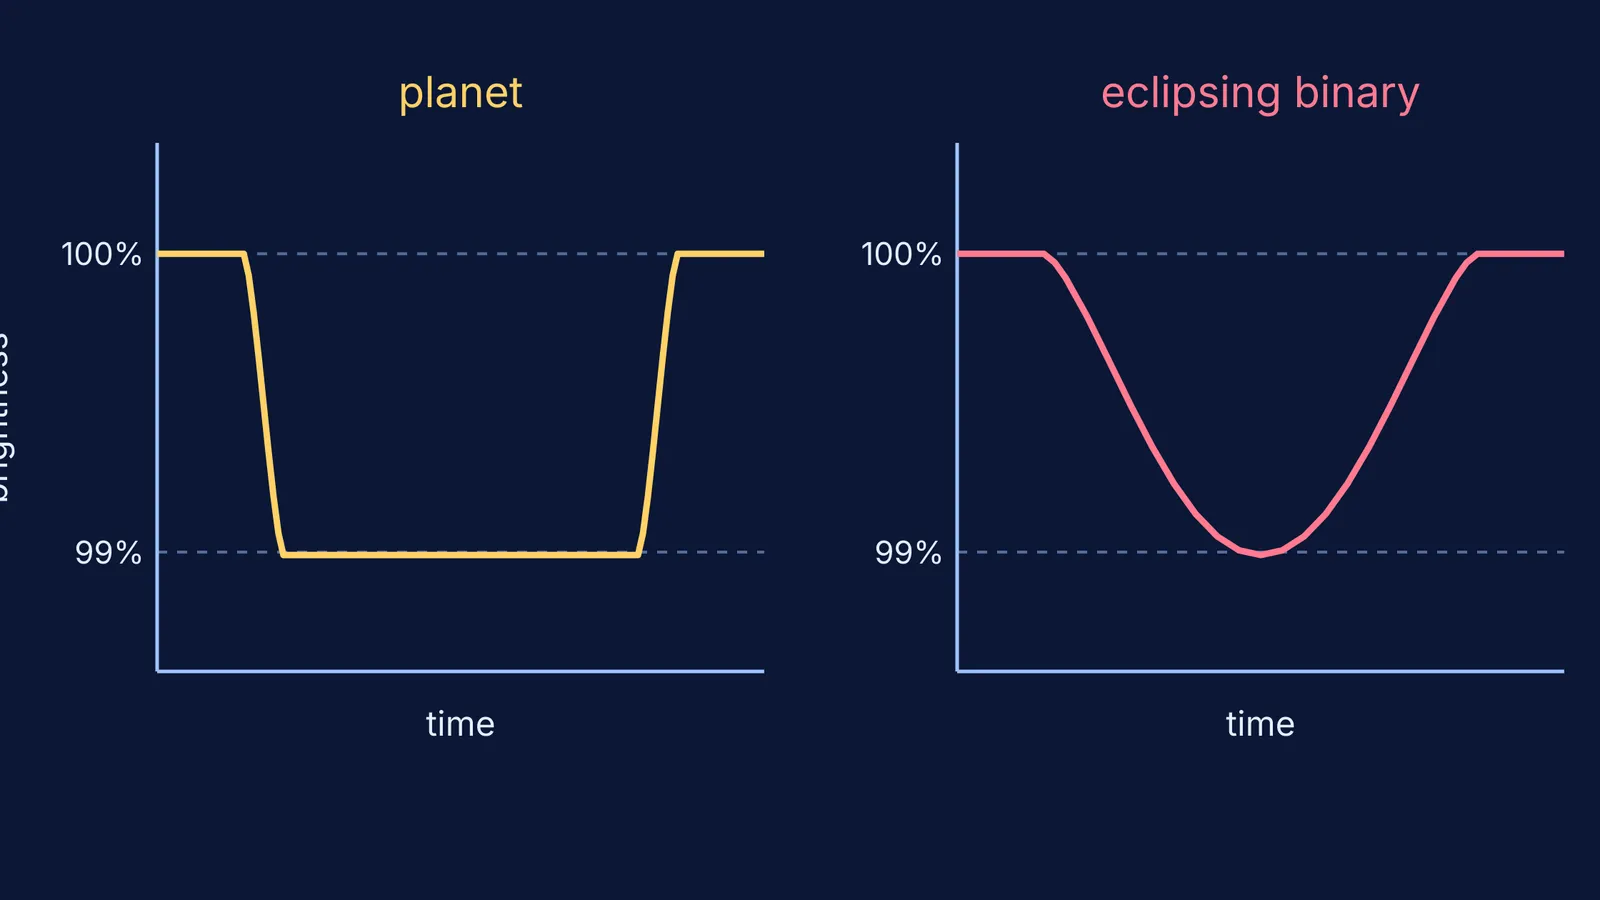
The main impostors are eclipsing binaries: two stars orbiting each other, either the target star itself or a fainter pair that happens to sit behind it in the same pixels (NASA Exoplanet Archive: false positive scenarios). Shallue and Vanderburg's network also had to reject instrument glitches and stars that simply vary in brightness on their own (arXiv).
Shape gives clues. Grazing eclipsing binaries can be spotted by their V-shaped dips, and many blended binaries by a shift in the centre of light on the detector (Morton and Johnson, 2011). The diagram above shows both shapes: a planet's flat floor and a grazing pair's V.
The AI has blind spots too. Only 8% of the planets and candidates in Shallue and Vanderburg's training set had weak signals, so it rarely saw faint real planets in training (arXiv).
Can students try finding exoplanets themselves?
Yes. Kepler and TESS data are public, and Lightkurve is an open-source Python package for exploring them (Lightkurve). Its own tutorial uses the star Kepler-69 (Lightkurve planet-search tutorial):
Install it with: python -m pip install lightkurve --upgrade (quickstart)
Download the long-cadence Kepler light curves for Kepler-69 with search_lightcurve.
Stitch the quarters together, flatten slow brightness drifts and remove outliers.
Search for repeating dips with a box least squares (BLS) periodogram.
Fold the light curve at the best period so every transit lands on top of the others. The tutorial finds Kepler-69 b at 13.72 days.
Then check your result like a classifier would:
Does the dip repeat at the same period?
Is the floor flat, or is it a V?
Does the depth give a sensible planet size with the square rule above?
The period you fold on links to Kepler's third law; we tell the story of how Johannes Kepler found his three laws in Tycho Brahe's data. For the start of the hunt, read about Mayor, Queloz and the first planet found around a Sun-like star. Curious about competitions? See getting started with the astronomy olympiad, NSEA and INAO.
If the square-ratio algebra or the idea of folding a light curve is not clicking yet, Fermi's AI tutor can work out what you already know and build a plan for the session, and the Fermi Simulation Lab has interactive simulations for ideas that are easier to see than to read.
Pick one star this week and try to find its dip before the tutorial shows you.