
On this page
A fizzy tablet in fridge-cold water lingers; in warm water it hisses away. That difference is a cheap kinetics experiment for the kitchen table, and its graph has the shape your Class 12 chemistry chapter draws with equations.
Does a fizzy tablet dissolve faster in hot water?
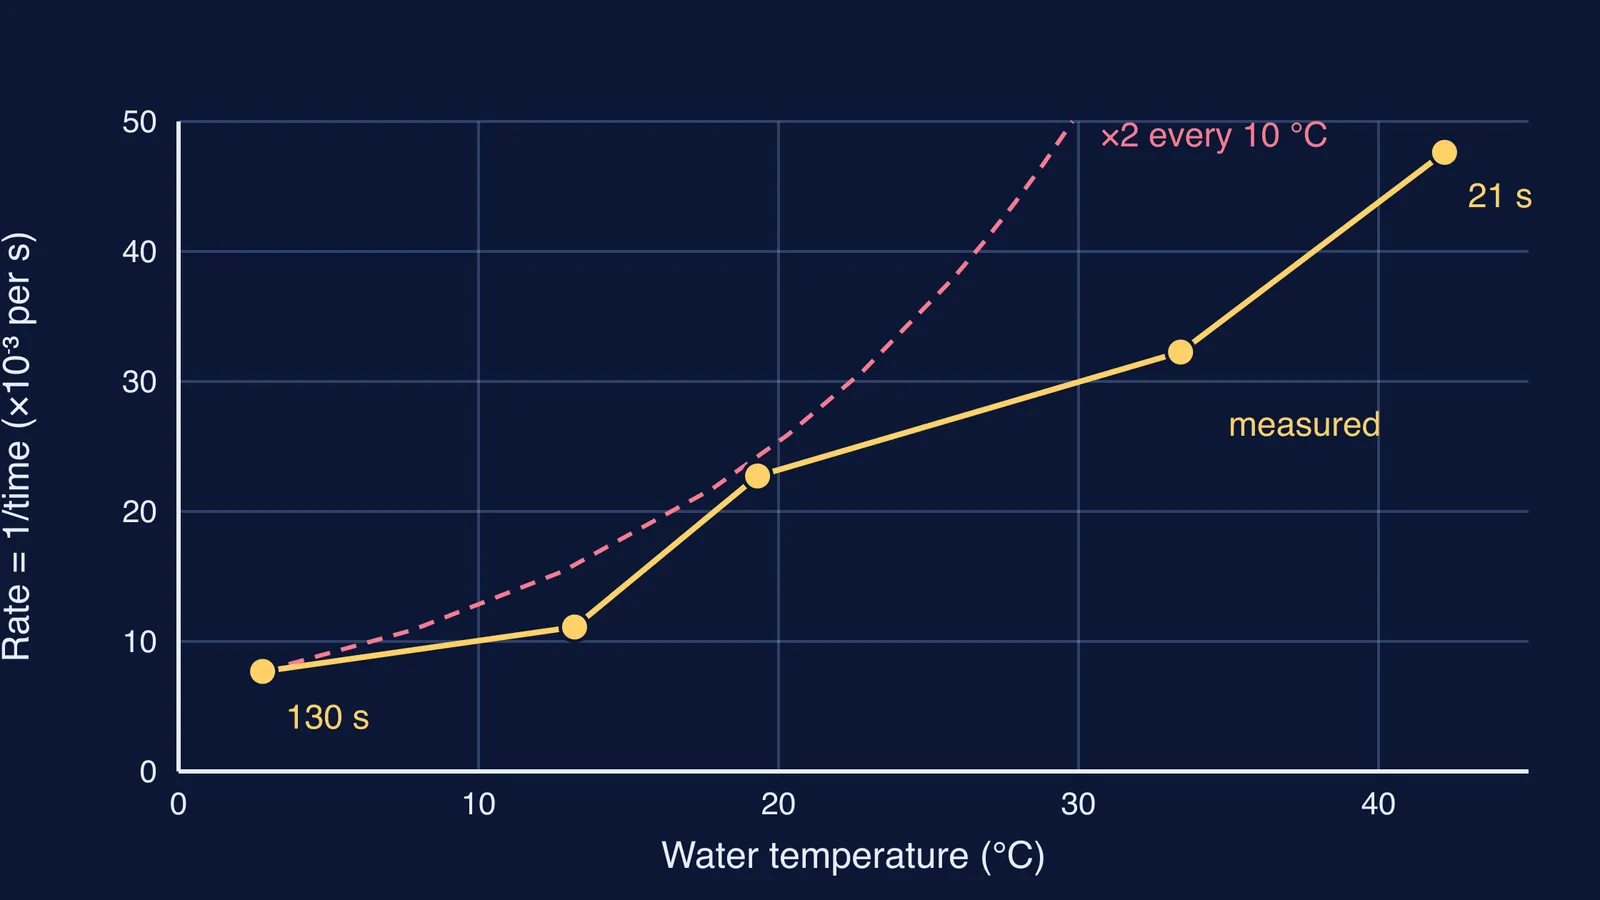
Yes, and by a lot. In a classroom version described by chemist Robert Perkins in Chem 13 News, published by the University of Waterloo, a tablet dropped into water at 2.8 °C took 130 seconds to disappear, while one at 42.2 °C took 21 seconds. His full set of sample student readings:
2.8 °C: 130 s
13.2 °C: 90 s
19.3 °C: 44 s
33.4 °C: 31 s
42.2 °C: 21 s
The fizz is carbon dioxide, Perkins notes. His tablet, Alka-Seltzer, is listed in the US DailyMed drug label database as citric acid, sodium bicarbonate and aspirin. It is a medicine, so an adult hands out the tablets and nobody drinks the test water.
Why does hot water make the reaction faster?
The NCERT Class 12 Chemistry chapter on chemical kinetics explains it with collision theory. Particles react only when they collide with enough energy (the activation energy) and the right orientation; NCERT calls these effective collisions.
Heating does not lower the energy barrier. It spreads the particles' energies so that a larger fraction of collisions clear it, which NCERT shows with the Maxwell–Boltzmann curve in section 3.4. Perkins adds that warmer water also means more collisions in the first place.
NCERT gives a rule of thumb: for a chemical reaction, a 10° rise in temperature nearly doubles the rate constant. Your tablet will probably not keep up. Perkins's readings rise about six times across roughly 40 °C, where steady doubling would predict about 15 times. From the slope of his graph, Perkins reports an activation energy of 29 kJ, while doubling every 10 °C near room temperature needs about 53 kJ/mol (from ln 2 = (Ea/R)(1/298 − 1/308)). A lower barrier gives a gentler rise. The tablet also has to wet, break up and dissolve, so treat this as a test of whether temperature speeds things up, not a precise measurement.
How do you run the test at four temperatures?
You need four identical tablets from one strip, one glass or steel tumbler, a measuring jug, a kitchen or aquarium thermometer, a phone stopwatch and a notebook.
Pick four temperatures about 10 °C apart, for example 5, 15, 25 and 35 °C. Mix fridge water with warm tap water to hit each one.
Pour the same volume each time, say 200 mL, into the same container.
Stir, read the temperature, write it down, then take the thermometer out.
Drop in a whole tablet and start the stopwatch the moment it touches the water.
Stop when the last solid piece disappears. Agree on this end point before you start.
Rinse and dry the container, and repeat each temperature three times. Use the middle value of the three.
Watch where the tablet sits, too. Perkins notes that it stays on the bottom in very cold water and floats on top in warm water.
How do you keep the test fair?
A fair test changes one thing (temperature) and measures one thing (time). Everything else stays fixed:
the same brand and strip of tablets, used whole (Perkins notes that crushing a tablet speeds it up by exposing more surface)
the same volume of water and the same container
no stirring once the tablet is in
a temperature read just before the drop, not guessed from the tap
the same person judging the end point every time
How do you turn the times into a graph?
Time is not rate: a shorter time means a faster reaction. So use rate = 1 ÷ time, as Perkins does when he treats 1/t as proportional to the rate constant. His data, worked through:
2.8 °C: 1 ÷ 130 = 0.0077 per second
13.2 °C: 1 ÷ 90 = 0.0111 per second
19.3 °C: 1 ÷ 44 = 0.0227 per second
33.4 °C: 1 ÷ 31 = 0.0323 per second
42.2 °C: 1 ÷ 21 = 0.0476 per second
Put temperature on the x-axis and rate on the y-axis. The points climb, and the climb gets steeper as the water warms. In your conclusion, say whether the rate at least doubled from coldest to warmest, which repeats disagreed most, and why.
To go further, plot ln(rate) against 1/T in kelvin: NCERT shows this gives a straight line with slope −Ea/R. Our explainer on finding activation energy from half-lives at two temperatures uses the same equation, and our science fair project ideas you can test at home help turn this into a school project.
A shifting energy curve is easier to see than to read. The Fermi Simulation Lab has interactive simulations for ideas like this, so you can compare what you watch on screen with what your stopwatch recorded.