
On this page
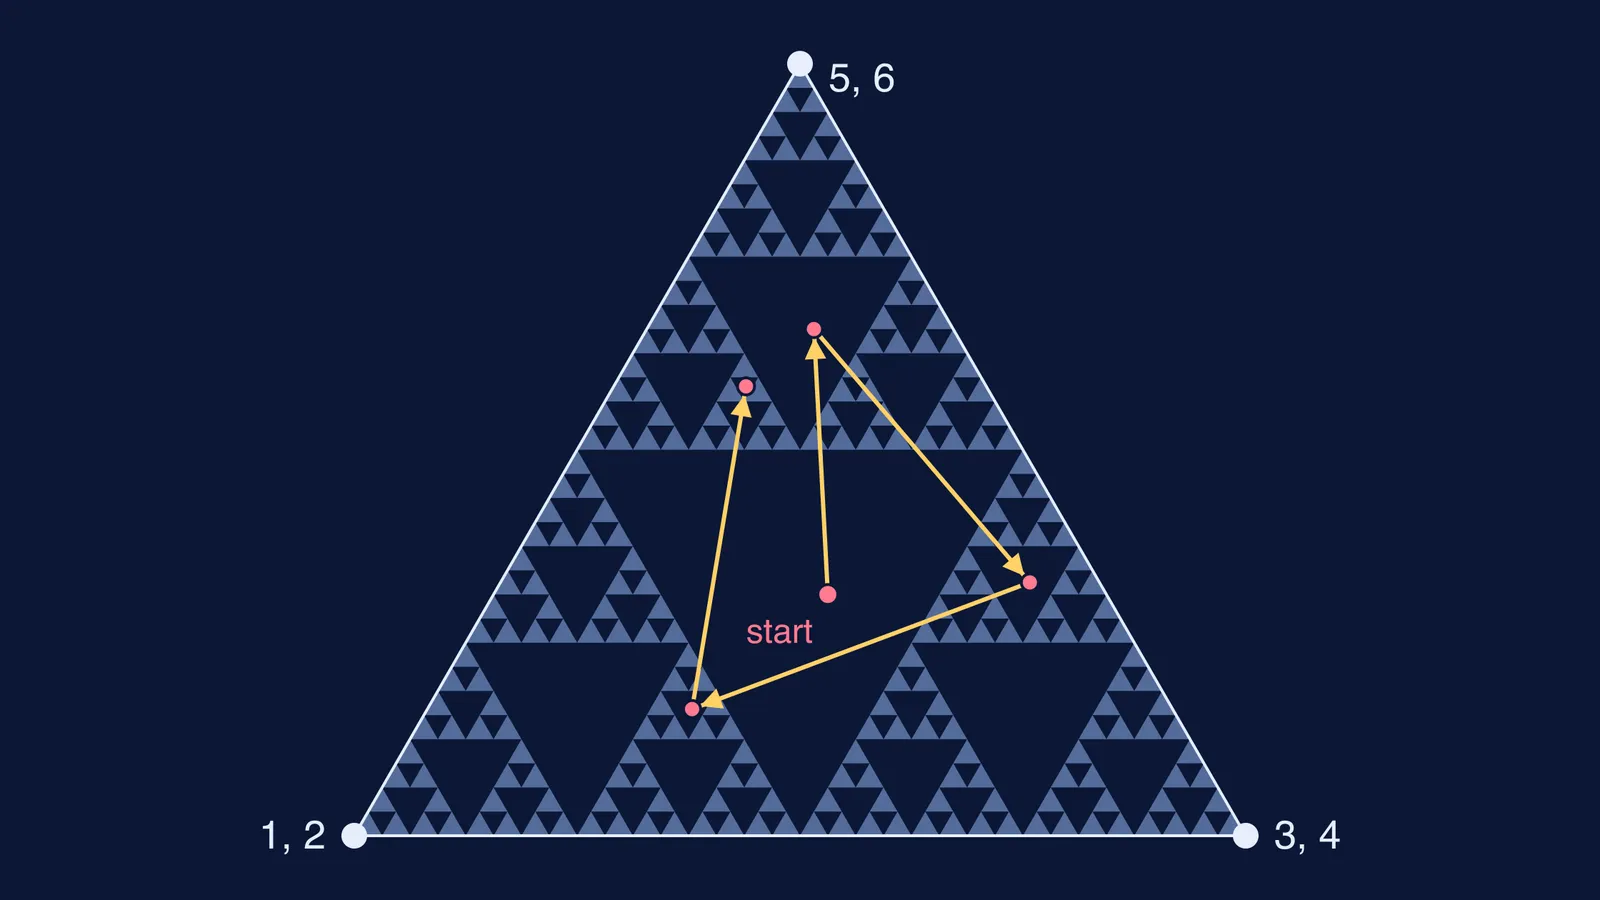
A handful of dots looks like a random mess. Keep going and a triangle full of triangle-shaped holes appears. This is the chaos game: a strict rule turning randomness into order.
What is the chaos game and how do you play it?
The chaos game is a way of creating a fractal from a polygon and a starting point chosen at random inside it (Wikipedia: Chaos game). Mathematician Michael Barnsley invented it in the 1980s, and to play it you need only paper, a pencil and a die (Lubiszewski, AVANT, 2010).
Mark the three corners of a large triangle: A at bottom left, B at bottom right, C at the top.
Put a dot anywhere inside it. This is your starting point.
Roll the die. A 1 or 2 means A, a 3 or 4 means B, and a 5 or 6 means C.
Measure halfway from your latest dot to that corner and mark a new dot there.
Go back to step 3, starting from the new dot.
The shape that slowly appears is the Sierpinski triangle, which Wacław Sierpiński described in 1915. With pencil and paper, a rough outline shows after about a hundred dots, and detail begins to appear after a few hundred (Wikipedia: Sierpiński triangle). Read more about Wacław Sierpiński and his triangle.
Why do random dots make a Sierpinski triangle?
Jump halfway towards A from anywhere inside the big triangle and you land inside the half-size triangle in corner A. The same is true for B and C. So after one jump, your dot is in a half-size corner triangle, never in the upside-down triangle in the middle.
Every later dot is also the result of a jump, so none can land in that middle hole. Apply the same argument inside each half-size triangle and each loses its own middle. After k jumps a dot avoids every hole down to one part in 2 to the power k of the side; after 10 jumps that is under a thousandth, smaller than your pencil dot.
The die decides only the order in which dots arrive. The halfway rule decides where they may land. That is why two people with different rolls draw the same picture.
Each stage of the pattern keeps three quarters of the area left by the previous stage, so after n stages (3/4) to the power n of the area remains, which shrinks towards zero (Wikipedia: Sierpiński triangle). Its fractal dimension is log 3 divided by log 2, about 1.585, between a line and a filled area (same source).
What happens if you change the jump fraction or the corners?
Predict before you roll. A jump of fraction r towards a corner shrinks the whole picture into a copy (1 minus r) times as big, parked at that corner. Then ask: do the copies overlap, just touch, or leave gaps?
Triangle, r = 1/2: three half-size copies that touch at their corners. Result: the Sierpinski triangle.
Triangle, r = 2/3: three one-third-size copies with space between them. Prediction: separate clusters of dots.
Square, r = 1/2: four half-size copies tile the square exactly. Prediction: no pattern, and the square fills evenly with points (Wikipedia: Chaos game).
Square, r = 1/2, but you may not choose the same corner twice in a row: that one extra rule is enough to make a fractal appear in the square (same source).
Square, r = 2/3, with the midpoints of the four sides added as targets: eight one-third-size copies, which give the Sierpinski carpet (same source).
Pentagon: five copies just touch when r is about 0.618, as in Wikipedia's pentagon picture (same source).
As Wolfram MathWorld notes, the chaos game gives a fractal sometimes, but not always (MathWorld: Chaos Game). The overlap question is a good first guide to which you will get, but the dots have the final say.
How can you try it in a spreadsheet or a classroom?
For thousands of dots, use Excel or Google Sheets:
Type 0.3 in C2 and 0.3 in D2 as the starting point.
In B3, type =RANDBETWEEN(1,3) to roll a three-sided die.
In C3, type =C2+(CHOOSE(B3,0,1,0.5)-C2)/2 for the new x.
In D3, type =D2+(CHOOSE(B3,0,0,0.866)-D2)/2 for the new y.
Select B3 to D3 and fill down to row 3000, then make an XY scatter chart of columns C and D with small markers.
To test r = 2/3, change the /2 in both formulas to /1.5 and fill down again.
In class, give every student a tracing sheet with the same three corners and ask for 20 dots each. Stack the sheets against a window: separate rolls, one shared triangle.
If you would rather see it than plot it, the Fermi Simulation Lab has interactive simulations for ideas that are easier to see than to read. And if a step in the halfway argument does not click, Fermi's AI tutor can draw the figure with you and check your understanding as it goes.
Next, see how random points can estimate pi, and read about Benoit Mandelbrot's work on fractals.