
On this page
The falling line of blood pressure sticks better if you predict the numbers first, then follow one drop of blood from the aorta back to the heart and plot what you find. Before you read on, guess three values: the pressure in a large artery, in a capillary, and in a vein near the heart. Then guess which kind of vessel causes the biggest drop.
What is the blood pressure in arteries, capillaries and veins?
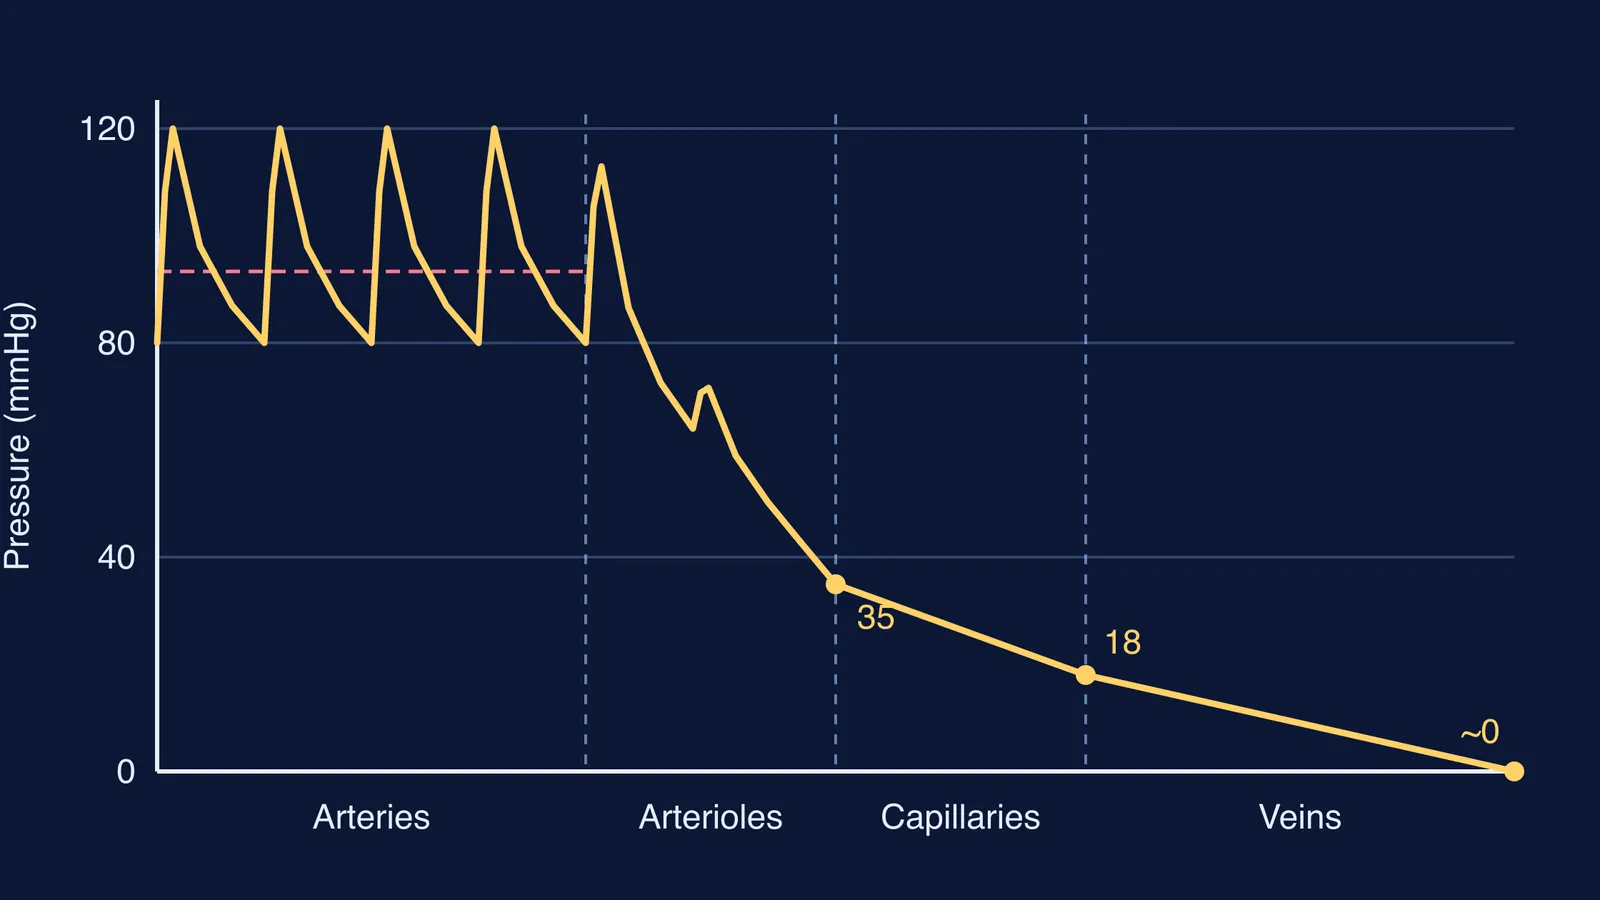
In the aorta, blood pressure swings between about 120 mmHg in systole and 80 mmHg in diastole, according to BasicPhysiology.org. The same source says that after the arterioles, pressure has dropped to about 30-35 mmHg and no longer pulses, and that the lowest pressure in the systemic circulation is where blood enters the right atrium, close to 0 mmHg.
The open textbook OpenStax Anatomy and Physiology gives the capillary values: capillary hydrostatic pressure is about 35 mmHg at the arterial end and about 18 mmHg at the venous end.
These are textbook values for a resting adult. A home blood pressure reading measures something different. If you are worried about your own readings, ask a doctor.
Why does blood pressure drop from arteries to veins?
Pressure is what pushes blood forward, and the push gets used up overcoming resistance in each vessel. A StatPearls review on peripheral vascular resistance explains that pressure changes very little in the aorta and large arteries, but drops sharply in the arterioles, which are the main regulators of resistance.
The physics is Poiseuille's law, R = 8Lη/(πr⁴), where η is the blood's viscosity. The same review says resistance changes with the fourth power of the radius.
If you halve a vessel's radius, its resistance becomes 2⁴ = 16 times larger.
If an arteriole narrows by just 10%, its resistance rises by a factor of 1/0.9⁴, about 1.52, or roughly 50% more.
It works like voltage across resistors in series in a circuit: the biggest drop happens across the biggest resistance. Viscosity is also why Bernoulli's equation doesn't fit here, as our post on when Bernoulli's equation fails explains.
Worked example: plot the drop yourself
Start with mean arterial pressure. OpenStax gives MAP = diastolic + (systolic - diastolic)/3. For 120/80, that is 80 + 40/3, about 93 mmHg. Then use the capillary values above.
Arteries to the start of the capillaries: 93 to 35 mmHg, a drop of 58 mmHg. That is about 62% of the total.
Across the capillaries: 35 to 18 mmHg, a drop of 17 mmHg, about 18%.
Venules and veins to the right atrium: 18 to about 0 mmHg, a drop of 18 mmHg, about 19%.
The three drops add up to the full 93 mmHg. Draw the vessels along the x-axis and pressure on the y-axis. You'll get a wiggly band in the arteries, a steep fall in the arterioles, and a gentle slope from there to the heart.
If capillaries are the narrowest, why isn't the biggest drop there?
Capillaries sit side by side, in parallel. OpenStax notes that their total cross-sectional area is far greater than that of any other vessel type, that blood slows sharply in them, and that the arterioles are the site of greatest resistance. Resistors in parallel have a smaller combined resistance than any one alone, so capillaries take a smaller share of the drop.
The low pressure is useful. OpenStax compares capillary pressure with the blood's colloid osmotic pressure of about 25 mmHg. At the arterial end the net filtration pressure is 35 - 25 = 10 mmHg, so fluid moves out into the tissues. At the venous end it is 18 - 25 = -7 mmHg, so most of that fluid is drawn back in.
How does blood get back to the heart at such low pressure?
According to OpenStax, about 64% of the body's blood is in the systemic veins. With so little pressure left, veins need help. Contracting skeletal muscles squeeze nearby veins, and one-way valves let blood move only towards the heart. Breathing in lowers pressure in the chest, which draws blood up the large veins.
To follow the blood into the heart, see our cardiac cycle pressure graph.
How to test your predictions
A diagram shows you the curve. Changing one thing and watching the whole curve respond shows you why. Try this plan:
Write down your predictions for the aorta, the capillary entry and the right atrium.
Trace one drop of blood and note the pressure as it leaves each type of vessel.
Plot your notes and mark where your predictions were furthest off.
Narrow the arterioles. Before you check, predict whether pressure goes up or down in the arteries and in the capillaries.
Explain the result in one sentence using R ∝ 1/r⁴.
The Fermi Simulation Lab has interactive simulations for ideas that are easier to see than to read. If your prediction and the plot don't match, Fermi's AI tutor can work through the mismatch with you, explaining, asking or showing depending on where you are stuck.