

On this page
The pressure graph of one heartbeat is the core of the Wiggers diagram, and it is tempting to memorise it. You don't need to. Every valve event on it follows one rule, so you can predict the graph before you look.
In Advances in Physiology Education, Jamie Mitchell and Jiun-Jr Wang note that its timings "could simply be memorized", and that the challenge is getting learners to understand the mechanisms behind them. A 2026 paper by E. P. Silldorff and G. D. Robinson derives the diagram from scratch; its abstract opens with the line "Prediction in physiology is the pinnacle of learning outcomes".
What does the cardiac cycle pressure graph show?
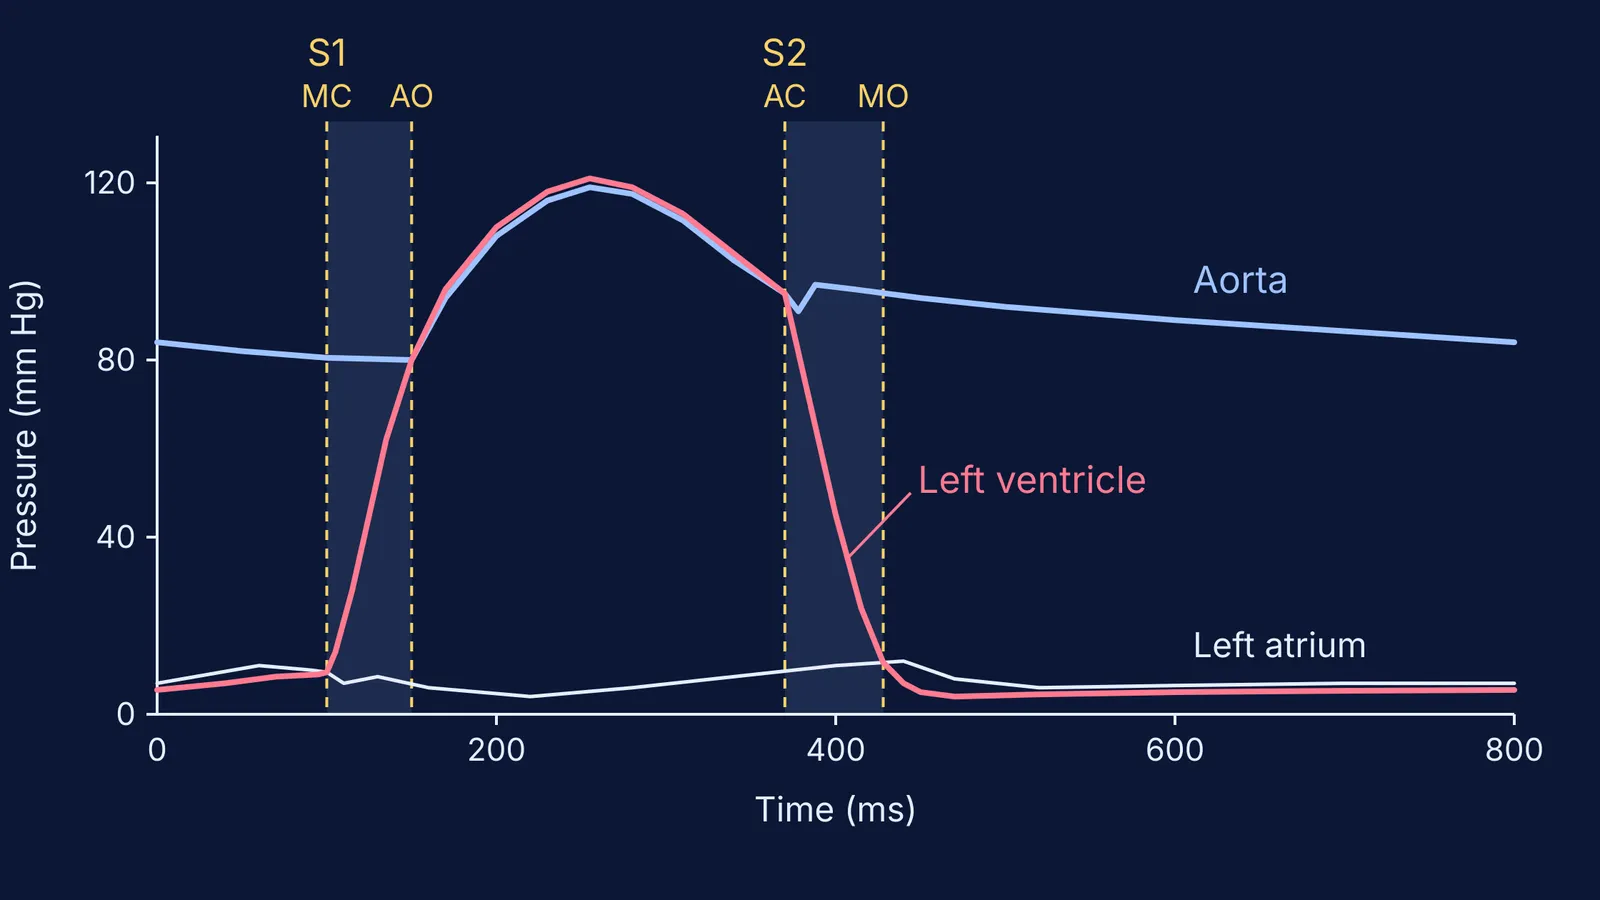
The graph above plots three left-heart pressures over one beat: left atrium (white), left ventricle (pink) and aorta (blue). Typical resting pressures are about 120 mm Hg systolic and 10 mm Hg diastolic in the left ventricle, 120/80 mm Hg in the aorta and 8–10 mm Hg in the left atrium, according to TeachMePhysiology.
Here is the one rule. Fluids move from regions of higher pressure to regions of lower pressure, as OpenStax Anatomy and Physiology puts it, and heart valves are one-way doors that blood pushes open or shut. So a valve changes state only at the moment two lines cross.
The mitral valve is open whenever atrial pressure is above ventricular pressure.
The aortic valve is open whenever ventricular pressure is above aortic pressure.
When does each valve open and close?
Cover each step and predict which line crosses which before reading it. The timings come from OpenStax: atrial systole lasts about 100 ms, ventricular systole about 270 ms and ventricular diastole about 430 ms. Atrial systole happens while the ventricles are still relaxed, so these phases overlap rather than simply adding up.
Late diastole. The atrial line sits just above the ventricular line, so the mitral valve is open and the aortic valve is shut. OpenStax says about 70–80 percent of ventricular filling happens this way, before the atria contract.
Atrial contraction. The bump in the atrial line adds the remaining 20–30 percent, topping the ventricle up to about 130 mL (the end-diastolic volume, per OpenStax).
Mitral valve closes. Ventricular pressure shoots above atrial pressure: crossing one, and the first heart sound.
Isovolumic contraction. Both valves are shut, so pressure climbs steeply while volume stays the same.
Aortic valve opens. The ventricular line overtakes the aortic line at about 80 mm Hg, the aortic diastolic pressure: crossing two. Blood is ejected and both lines rise towards 120.
Aortic valve closes. Ventricular pressure drops below aortic pressure: crossing three. A brief backflow makes the dicrotic notch in the aortic trace. OpenStax gives a stroke volume of 70–80 mL, leaving 50–60 mL behind.
Isovolumic relaxation. Both valves are shut again; ventricular pressure falls steeply.
Mitral valve opens. The ventricular line drops below the atrial line: crossing four. Filling restarts.
What makes the lub and dub heart sounds?
OpenStax states that S1, the "lub", is the sound of the atrioventricular valves closing, and S2, the "dub", is the sound of the semilunar valves closing. Notice that both are closings. OpenStax says a normal, healthy heart has only these two audible sounds, so the valves opening add no sound of their own.
Each sound is really two valves. On CV Physiology, Richard Klabunde explains that mitral closure comes slightly before tricuspid closure, splitting S1 by about 0.04 seconds, and the aortic valve closes before the pulmonic valve at S2.
How do you practise with an interactive graph?
A static picture shows you the answer; a graph you can change makes you predict first. Try this in one sitting:
On blank axes, sketch the aortic line (80 to 120 mm Hg), then the ventricular line, then the atrial line near the bottom.
Circle the four crossings and label each valve and sound.
Shade the two stretches where both valves are shut: the isovolumic phases.
Change one thing and predict. If aortic pressure at the end of diastole were 100 mm Hg instead of 80, would the aortic valve open earlier or later? (Later: the ventricle must climb higher, so isovolumic contraction lasts longer.)
Break a valve. If the mitral valve leaked, would ventricular volume stay constant during contraction? (No: blood would leak back into the atrium.)
Watching the crossing points shift as you move a slider is where an interactive version helps. The Fermi Simulation Lab has interactive simulations for ideas that are easier to see than to read. If you get stuck on why a line moves, Fermi's AI tutor notices where you are stuck and decides whether to explain, ask or show.
For the rest of the chapter, see our guide to body fluids and circulation, from the cardiac cycle to blood groups, the story of Willem Einthoven and the string galvanometer behind the ECG, and what research says about simulations versus static diagrams.
Tonight, draw the three lines from memory on blank paper and find the four crossings.


