On this page
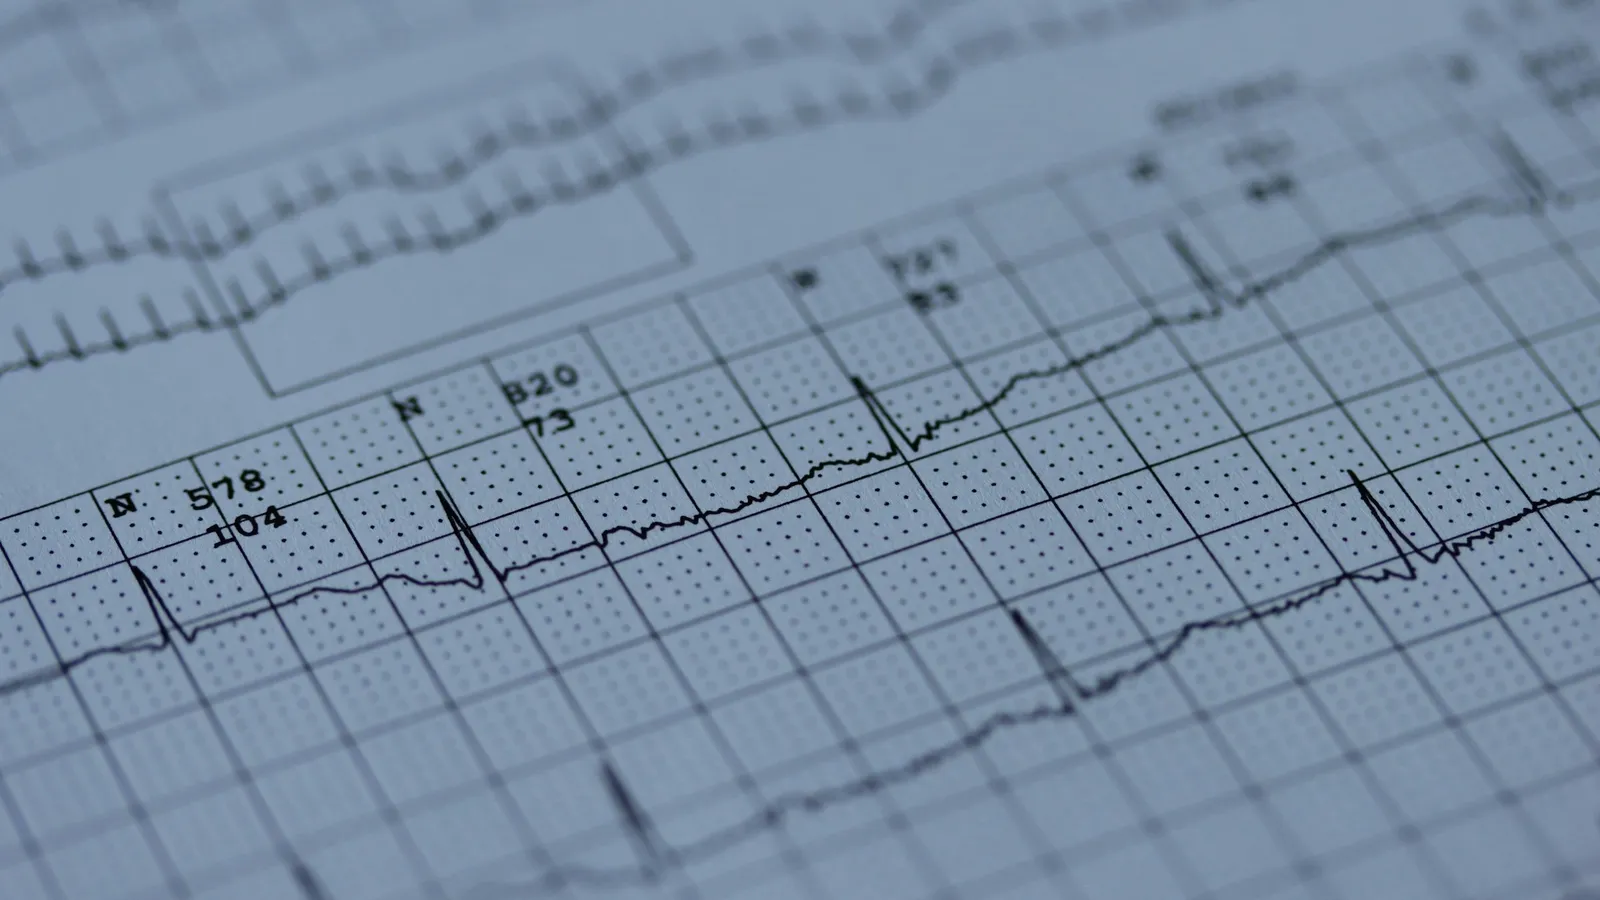
The ECG is the one graph that every biology student, every medical drama and every hospital ward shares. NCERT asks you to know its P wave, QRS complex and T wave. Behind those letters is a physicist's problem: how do you record the heart's tiny, fast-changing electrical signals through the skin? Willem Einthoven solved it with a very thin thread in a magnet. This post explains his instrument, his leads, and the simple equation that came with them.
Who was Willem Einthoven?
His Nobel biography says he was born on 21 May 1860 in Semarang, on Java, then part of the Dutch East Indies. His father died when he was six, and the family moved to Utrecht. He studied medicine at Utrecht, and in 1885 he was appointed Professor of Physiology at the University of Leiden, taking up the post in 1886. The biography adds that "his genius was actually more orientated towards physics than physiology."
What was wrong with earlier ECG recordings?
The heart's electrical activity could already be recorded. A review in Cardiac Electrophysiology Review, Barold (2003), says Augustus Waller recorded the first ECG from an intact human heart in May 1887 in London, using a mercury capillary electrometer. The tracings were poor.
In his Nobel lecture, Einthoven explains the problem. Because of the capillary electrometer's imperfections, the recorded curve did not show the true changes in potential. A more accurate curve could be rebuilt by calculation from the instrument's properties, but that took a long time, which "stood in the way of the practical use of electrocardiography." His biography says he first worked out those mathematical corrections, then built a new instrument so they would not be needed.
How does a string galvanometer work?
The lecture opens with the principle. A thin conducting thread is stretched like a string in a magnetic field. When current flows, the thread is pushed sideways, at right angles to the magnetic field lines, by an amount proportional to the current. A magnified image of the thread is photographed, giving a trace.
You know the physics from Class 12: a current-carrying conductor in a magnetic field feels a force F = BIL. Einthoven's design choices follow from that force and from the mass of the moving part:
A strong magnetic field increases the force for a given current.
A thinner, lighter string makes the instrument more sensitive. His lecture says the sensitivity is inversely proportional to the string's diameter, so the string should be made as thin as possible.
Tension trades sensitivity against speed. A slack string moves further for a weak current but responds slowly; a tight one is fast but less sensitive.
The biography says making the instrument precise enough for physiologists took three years of laborious work. Barold's review says Einthoven published his first article on the string galvanometer in 1901 and a more detailed description in 1903, with ECGs recorded on it.
What are Einthoven's three leads?
In the lecture, Einthoven says the ECG should be taken by three leads: Lead I between the right and left hands; Lead II between the right hand and left foot; Lead III between the left hand and left foot. Readings from these leads are linked:
Lead III = Lead II − Lead I
He used this as a quality check. Recording all three at once, if the measured curves obeyed the formula, showed they had been taken correctly. Barold's review adds that he pictured the leads as the sides of an equilateral triangle, used to work out the heart's electrical axis.
The equipment was large and fixed. Barold notes that a 1906 paper described sending ECGs by telephone wire from the physiology laboratory to the hospital about a mile away.
Worked example: using the lead equation and counting beats
The numbers below are sample numbers for practice, not real patient data.
Suppose the R wave measures 0.6 mV in Lead I and 1.0 mV in Lead II at the same instant. Then Lead III = 1.0 − 0.6 = 0.4 mV.
If Lead I were 0.8 mV and Lead III 0.3 mV, rearrange: Lead II = Lead I + Lead III = 0.8 + 0.3 = 1.1 mV.
Heart rate comes from counting QRS complexes, as NCERT Class 11 Biology Chapter 15 notes. If a strip shows 18 QRS complexes in 15 seconds (sample numbers), the rate is 18 × (60 ÷ 15) = 18 × 4 = 72 beats per minute.
Common mistakes:
Reversing the order of subtraction. It is Lead II minus Lead I, not the other way round.
Saying the P wave is ventricular. NCERT says the P wave is atrial depolarisation, QRS is ventricular depolarisation and T is ventricular repolarisation.
Saying the ECG measures the heart's pumping directly. It records electrical activity, which leads to contraction.
For the full cardiac cycle, read our guide to body fluids and circulation.
How was his work recognised?
The Nobel Prize in Physiology or Medicine 1924 was awarded to Einthoven "for his discovery of the mechanism of the electrocardiogram". He gave his Nobel lecture on 11 December 1925. In it he credited the English investigator Thomas Lewis, saying he doubted he would be standing there without Lewis's contributions, and ended by stressing that the new field had been opened "not by the work of a single investigator, but by that of many talented men" working across political boundaries.
What can a student take from Einthoven's way of working?
Fix the instrument, not just the data. He could correct the old recordings by calculation, but he built a tool that made the correction unnecessary.
Bring physics into biology. His success came from treating a medical problem as a measurement problem.
Build in a self-check. Lead III = Lead II − Lead I let him test his own recordings.
If the link between a current, a magnetic field and a moving wire still feels hazy, the Fermi Simulation Lab has interactive simulations for ideas that are easier to see than read.
Next step: sketch one ECG beat, label P, QRS and T with what each means, then write Einthoven's lead equation underneath from memory.