On this page
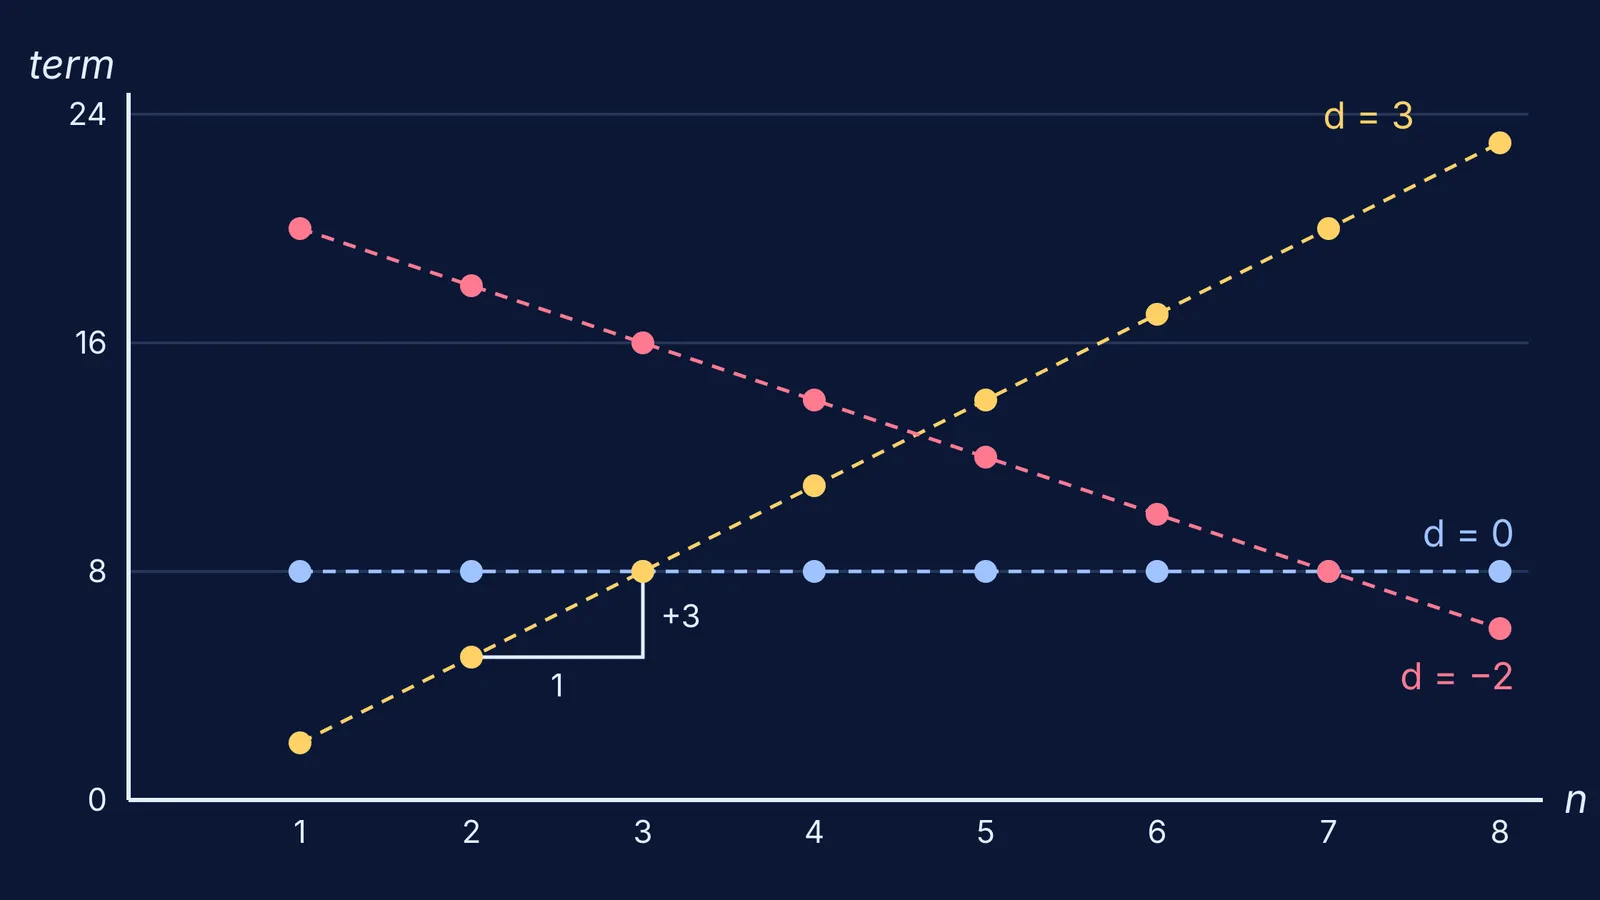
Write out 2, 5, 8, 11, 14 and plot each term against its position: (1, 2), (2, 5), (3, 8) and so on. The dots line up perfectly. It's how every arithmetic progression (AP) behaves, and once you see why, you get a second way to check AP answers: draw them.
Why do the terms of an AP lie on a straight line?
An arithmetic sequence is one where the difference between any two consecutive terms is a constant, called the common difference (OpenStax, College Algebra 2e, section 9.2).
The nth term is a_n = a + (n − 1)d, where a is the first term and d is the common difference. OpenStax writes it as a_n = a_1 + d(n − 1). Now rearrange it:
a_n = d × n + (a − d)
That's the form y = mx + c, with n in place of x. So the slope is d and the y-intercept is a − d. The same OpenStax section says arithmetic sequences "have a constant rate of change so their graphs will always be points on a line", and that the common difference is the slope.
One detail matters in exams. Position n only takes the values 1, 2, 3 and so on, so the graph is a row of separate dots that lie on a line, not a solid line. You can draw the line through them to read the slope, but there's no "2.5th term".
Predict first: what will the graph look like?
Before you plot anything, write down a guess. In a Harvard study of classroom physics demonstrations, students who predicted the outcome before seeing a demonstration showed significantly greater understanding, while students who only watched understood the concepts no better than students who didn't see it at all (Crouch, Fagen, Callan and Mazur, American Journal of Physics, 2004).
For each AP below, say aloud whether the line rises, falls or stays flat, and roughly how steep it is:
a = 2, d = 3
a = 20, d = −2
a = 8, d = 0
a = 2, d = 6
Then check: the first rises by 3 per step, the second falls by 2 per step, the third is flat, and the fourth is twice as steep as the first.
What happens when you change a and d?
Change one thing at a time and keep the other fixed.
Raise a, keep d. Try 2, 5, 8 and then 7, 10, 13. Every dot moves up by 5. The line shifts up but stays parallel to the first one, because the slope is still 3.
Raise d, keep a. Try d = 3 and then d = 6, with a = 2 both times. The first dot stays at (1, 2) and the line pivots around it, getting steeper.
Make d negative. The line falls from left to right. A decreasing AP is simply a line with negative slope.
Set d = 0. Every term is the same and the line is flat. It's still an AP, just one that never changes.
A line that shifts when you change a and tilts when you change d is the kind of idea the Fermi Simulation Lab is for: interactive simulations for ideas that are easier to see than to read.
How do you find a and d from a graph?
Try this worked example. A graph shows two dots of an AP at (3, 11) and (7, 23). Find the AP.
Slope = rise ÷ run = (23 − 11) ÷ (7 − 3) = 12 ÷ 4 = 3. So d = 3.
Use one dot: a_3 = a + 2d = 11, so a = 11 − 6 = 5.
Check with the other dot: a_7 = 5 + 6 × 3 = 23. Correct.
The AP is 5, 8, 11, 14, … and the line's intercept at n = 0 is a − d = 2.
If slope and intercept still feel abstract, our guide to what slope and intercept mean in word problems works through more cases. And because three terms of an AP are three points on one line, you can check whether given numbers form an AP the same way you'd check collinearity using slopes.
A two-minute check before your next AP test
Can you rewrite a + (n − 1)d as dn + (a − d) without looking?
Given a sketch, can you say the sign of d just from the tilt?
Can you find a and d from any two dots, then check with a third?
The line only describes the terms. The sum of n terms is a different graph, a curve rather than a line, which is why questions like finding n when the sum of an AP is given can have two answers. If you get a graph-reading question wrong, the Fermi Problem Library has a step-by-step solver that explains the reasoning rather than printing an answer, so you can see which step went off course.