On this page
The biodiversity chapter in NCERT Class 12 Biology has a curve that rises steeply and then flattens: more area, more species, with diminishing returns. One of the first people to write that pattern down as a formula was Olof Arrhenius, a Swedish soil chemist, in a 1921 paper.
Who was Olof Arrhenius?
Olof Arrhenius was born in Stockholm on 2 November 1895 and was the son of the Nobel-winning chemist Svante Arrhenius, according to Charles H. Smith's biographical sketch. He earned a D.Sc. in 1920 and worked at the Agricultural Experimental Station in Stockholm, then in sugar research in Java and Sweden. His father, Svante, received the 1903 Nobel Prize in Chemistry (French Wikipedia entry), and is the Arrhenius of the activation-energy equation you meet in chemistry; our post on the Arrhenius equation and activation energy covers that side of the family.
Olof's paper, "Species and Area", appeared in the Journal of Ecology, volume 9, issue 1, in September 1921, starting on page 95 (Crossref record, DOI 10.2307/2255763). In it he counted the number of species in plots of different sizes and fitted the results to a mathematical formula, deriving the species-area relation (Smith's sketch).
What is the species-area relationship?
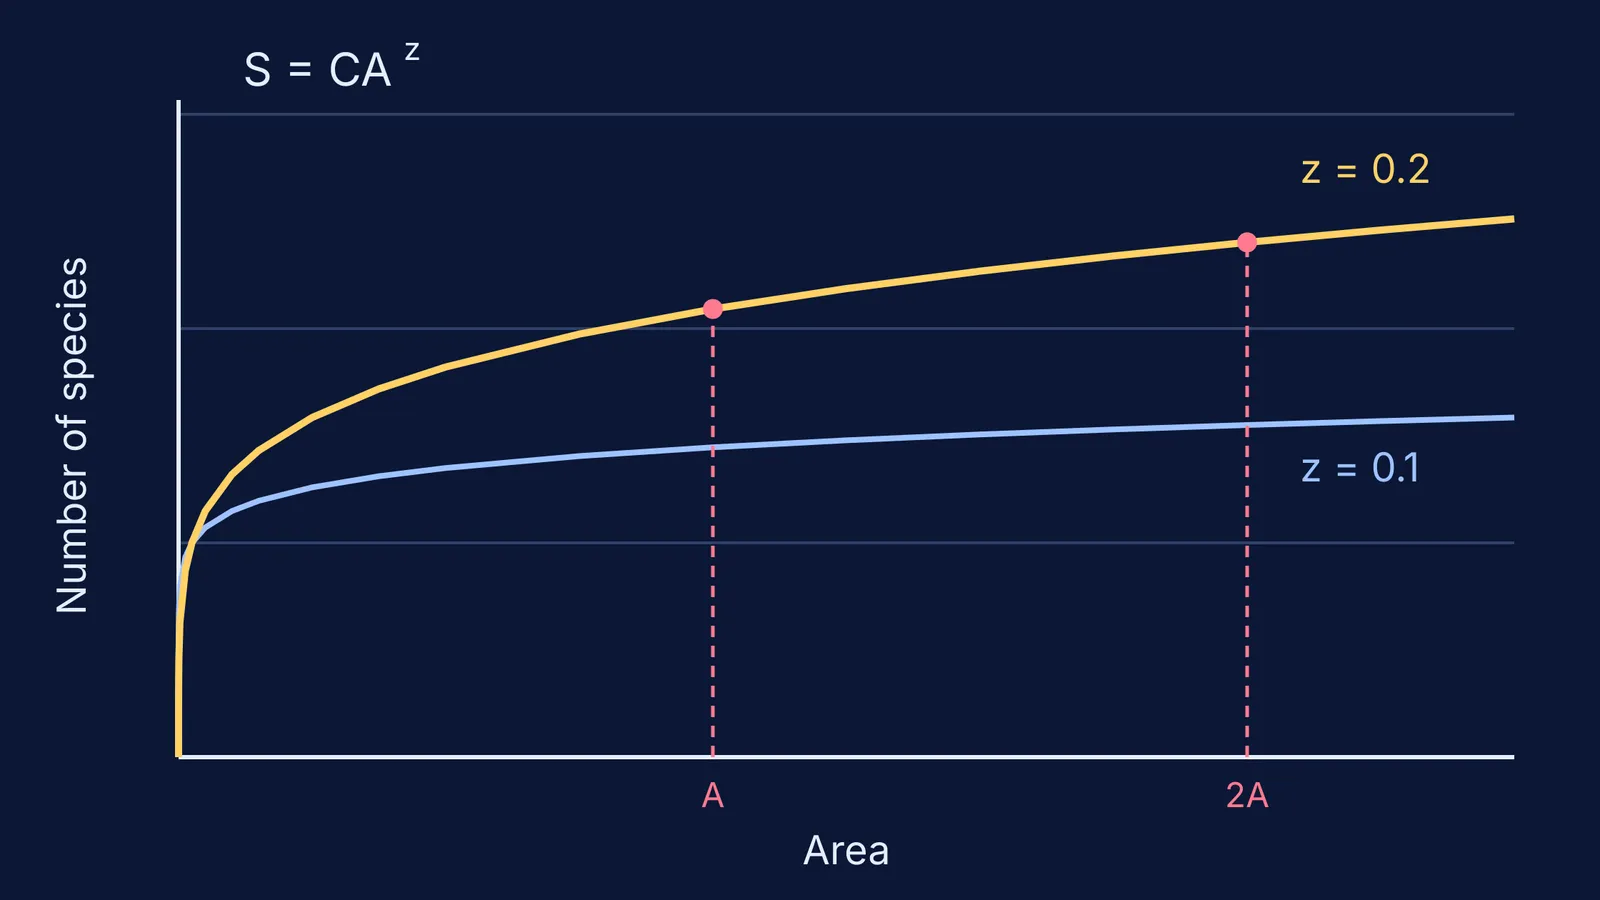
The species-area relationship says that the number of species S found in a region grows with its area A as S = CA^z, a power law that ecologists credit to Arrhenius in 1921 (Tung and Levin, arXiv).
C and z are constants: C sets how many species you find in one unit of area, and z sets how fast the count climbs. Taking logarithms turns the curve into a straight line, log S = log C + z log A, which is how NCERT's Class 12 chapter on biodiversity and conservation presents it. NCERT names z the slope of the line (the regression coefficient) and C the y-intercept.
Arrhenius was not the first to notice the pattern. NCERT credits Alexander von Humboldt with observing that species richness rose with explored area "but only up to a limit". A history chapter by Tjørve, Matthews and Whittaker says the discovery "cannot be attributed to a single person or time" and that the first mathematical models came in the early twentieth century (Cambridge University Press abstract). Arrhenius's power law was one of them.
What values of z does NCERT give?
According to NCERT, z lies in the range 0.1 to 0.2 regardless of taxonomic group or region, whether plants in Britain, birds in California or molluscs in New York state.
For very large areas such as whole continents, the same chapter says the slope is much steeper, with z between 0.6 and 1.2. For fruit-eating birds and mammals in the tropical forests of different continents, NCERT gives z = 1.15. Real data can run higher than the textbook band: Tung and Levin note that z often sits between 0.15 and 0.4 (arXiv).
How do you use S = CA^z in a problem?
C cancels when you compare two areas, so only z matters. Use the NCERT values (chapter PDF) and this three-step method.
Write the ratio: S2/S1 = (A2/A1)^z.
Put in the area ratio and z.
Turn the answer into a percentage change.
Worked example with z = 0.2:
Double the area: 2^0.2 is about 1.15, so roughly 15% more species, not twice as many.
Ten times the area: 10^0.2 is about 1.58, so roughly 58% more species.
Keep only 10% of a forest: 0.1^0.2 is about 0.63, so the model predicts about 37% fewer species in what remains.
With the continental slope z = 1.15, doubling the area gives 2^1.15, about 2.2 times the species.
Now run it backwards. Suppose a survey (made-up numbers for practice) finds 20 species in 1 hectare and 32 in 10 hectares. Then z = log(32/20) / log(10) = log 1.6, which is about 0.20, right inside NCERT's band.
The same area logic sits behind island biogeography, which we cover in our post on MacArthur and Wilson's island theory. It also pairs with the other NCERT pattern, explained in why the tropics hold more species.
How should you revise the species-area relationship?
Learn both forms: S = CA^z and log S = log C + z log A.
Know what each letter is, and that z is the slope.
Remember the two NCERT ranges, 0.1 to 0.2 and 0.6 to 1.2, and the 1.15 example.
Practise one ratio question and one find-z question until each takes under two minutes.
If logarithms are the shaky part, the Fermi Concept Library has a lesson on each concept in biology and mathematics, so you can patch the maths before the ecology. For practice, the Fermi Problem Library has worked problems with a step-by-step solver that explains the reasoning rather than printing an answer.