
On this page
Émile Amagat spent decades squeezing gases and liquids and measuring how much they shrank. His results, drawn as PV against P, are Amagat curves, the same graphs as Z against P in a real-gases chapter. Here is how to read them, checked against modern data.
Who was Émile Amagat, and why a mine shaft?
The Dictionary of Scientific Biography entry on Amagat dates his life from 1841 to 1915 and places him as a physics professor in Lyon.
In 1879, in a mine shaft at Verpilleux near Saint-Étienne, Amagat used a mercury column 327 metres high to measure the compressibility of nitrogen up to 430 atmospheres, according to the same entry. Check the number yourself: one atmosphere holds up 760 mm of mercury, and 327,000 mm ÷ 760 mm ≈ 430.
To go higher, he built a new gauge: a manometer with free-moving pistons in viscous liquids, which the entry says let him measure pressures above 3,000 atmospheres with certainty and regularity.
What are Amagat curves?
An Amagat diagram plots the product PV against P for a fixed amount of fluid at one constant temperature (Diagramme d'Amagat, Wikipédia). Boyle's law says PV stays constant at fixed temperature, so for an ideal gas every isotherm is a flat horizontal line.
The compressibility factor is Z = PV/nRT, and Z = 1 for an ideal gas (Compressibility factor, Wikipedia). At fixed n and T, nRT is a constant, so dividing PV by it only rescales the y-axis: an Amagat curve and a Z vs P graph are the same picture.
How do you read a PV vs P graph?
Use four steps on every curve. Steps 2 and 4 follow the compressibility factor explanation.
Find the flat line. That is PV = nRT, or Z = 1, the ideal gas.
Look at the start. A curve that dips below the line has Z < 1: the gas takes up less room than an ideal gas would, because molecules attract each other.
Find the bottom. The minimum is where the dip turns round. The French Wikipédia page calls these minima Boyle-Mariotte points; joined across temperatures, they form the Boyle-Mariotte curve.
Follow the climb. At high enough pressure the curve rises above the line, Z > 1, because crowded molecules repel and the real molar volume exceeds the ideal one.
Temperature changes the shape. Above the Boyle temperature the dip vanishes and Z stays above 1; for nitrogen the Boyle temperature is 327 K, according to the compressibility factor article. Our post on why the Boyle temperature equals a/Rb shows where that comes from in the van der Waals equation.
Worked example: how do you get Z from real data?
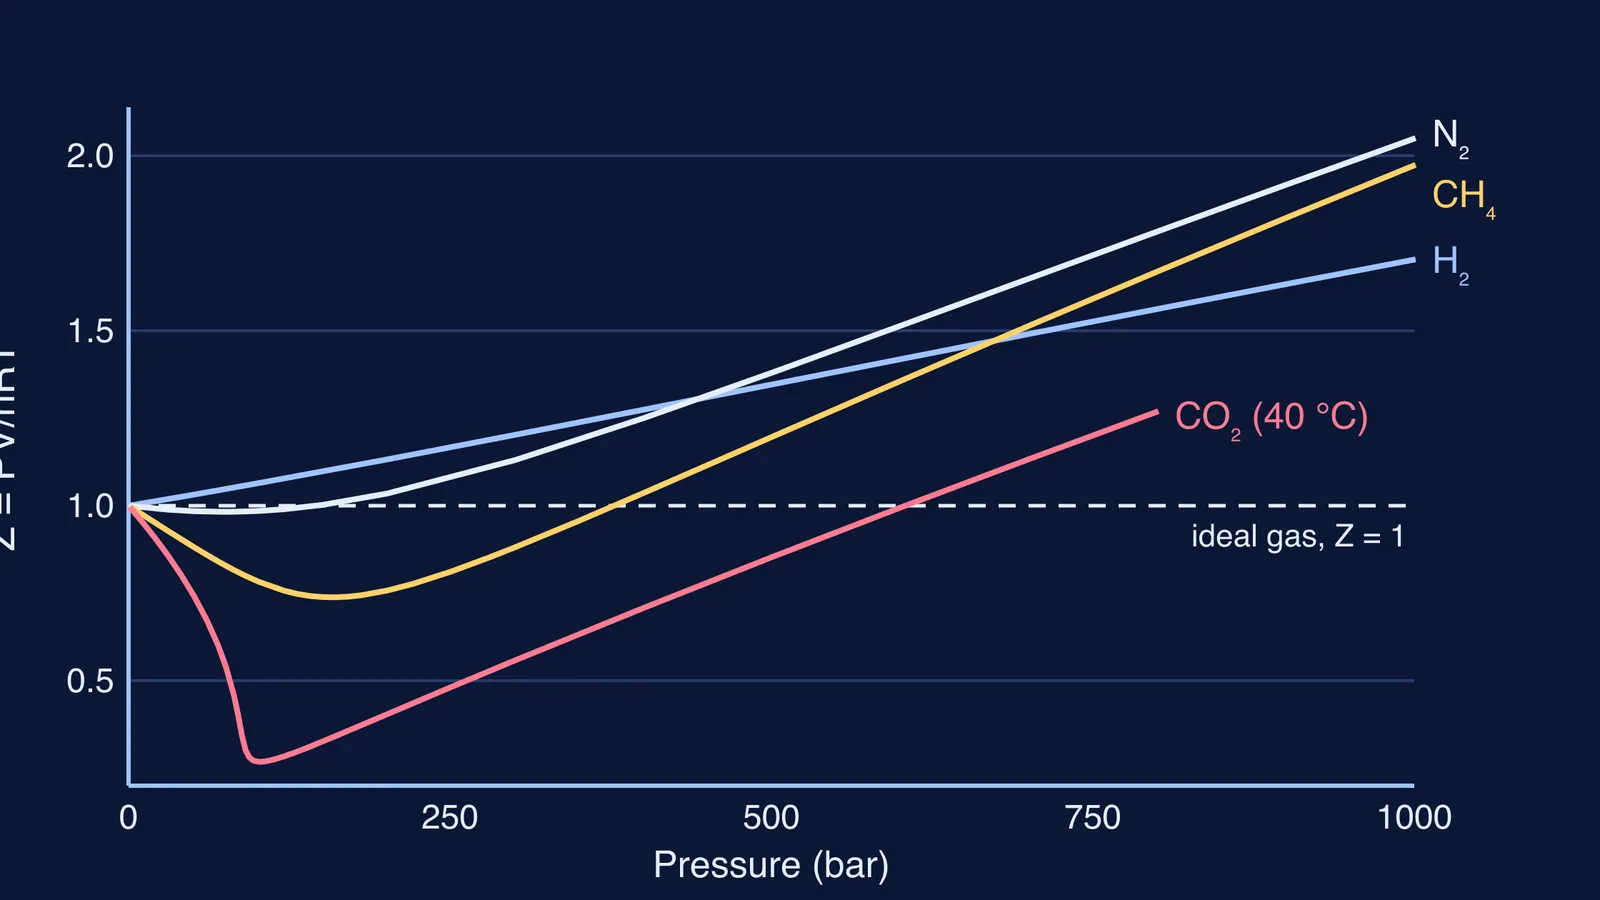
The chart at the top uses molar volumes from the NIST Chemistry WebBook fluid data, with Z = PV/RT and RT = 22.711 L bar/mol at 0 °C. Here is the method for methane at 161 bar.
Ideal molar volume: RT/P = 22.711 ÷ 161 = 0.1411 L/mol.
Real molar volume from NIST: 0.1042 L/mol.
Z = 0.1042 ÷ 0.1411 ≈ 0.74.
So at 161 bar and 0 °C, methane fills about 74% of the ideal-gas volume, and a fixed tank holds about 35% more of it than PV = nRT predicts (1 ÷ 0.74 ≈ 1.35). The same steps on the NIST isotherms give four stories:
Hydrogen at 0 °C: Z = 1.06 at 101 bar and 1.70 at 1,001 bar, with no dip at all.
Nitrogen at 0 °C: a shallow dip to about 0.98 near 70 to 80 bar, back to 1.00 near 151 bar, then 2.05 at 1,001 bar.
Methane at 0 °C: a deep dip to about 0.74 near 161 bar, crossing Z = 1 between 371 and 381 bar.
Carbon dioxide at 40 °C: Z plunges to about 0.27 near 100 bar, then climbs back to 1.00 near 601 bar.
For more practice on the signs, see our explainer on what Z > 1 and Z < 1 mean.
Is the PV vs P graph still in the syllabus?
Part I of the current NCERT Class 11 Chemistry book (2026-27 reprint) runs from Some Basic Concepts of Chemistry to Equilibrium with no unit on gases (NCERT Part I contents). The JEE Advanced 2026 syllabus still lists "Deviation from ideality, van der Waals equation" under States of Matter: Gases and Liquids. So for JEE Advanced, Amagat curves are fair game.
If the theory behind a and b is the gap, the Fermi Concept Library gives each chemistry concept its own lesson and its place in the map. If your Z numericals go wrong at the units step, the Fermi Problem Library has worked problems with a step-by-step solver that explains the reasoning rather than printing an answer.
Next, meet the person behind a and b: how Johannes van der Waals explained real gases.