
On this page
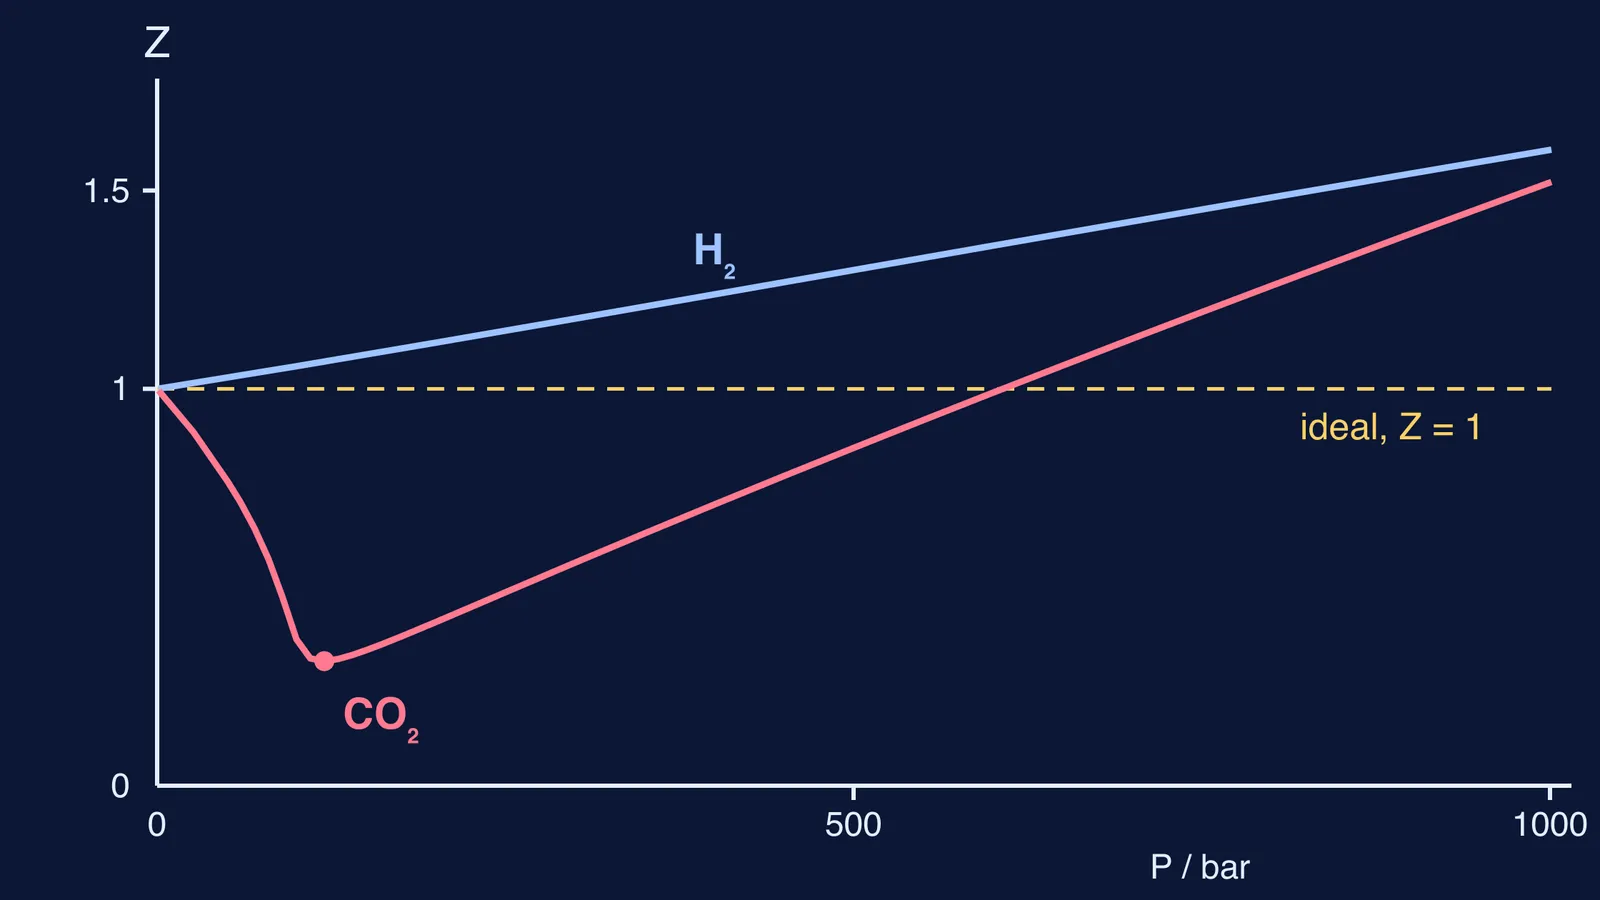
The compressibility factor usually arrives as a graph: a deep dip for CO₂, a straight climb for H₂. It is easier than it looks once you know the one question it answers: does this gas take up more room, or less, than an ideal gas would?
What is the compressibility factor Z?
The compressibility factor Z is the measured PV divided by nRT, which equals the real molar volume of the gas divided by the ideal molar volume at the same temperature and pressure (OpenStax Chemistry 2e, section 9.6). For an ideal gas Z = 1 exactly, so the distance from 1 measures how non-ideal the gas is.
Read it as a ratio of volumes:
Z = 1: the gas takes exactly the room the ideal gas law predicts.
Z < 1: it takes less room, so something is pulling the molecules together.
Z > 1: it takes more room, so something is keeping them apart.
What does Z less than 1 mean?
Z < 1 means attractions are winning: as pressure brings molecules closer, their mutual pull draws them in and the gas fits into a smaller volume than the ideal law predicts (OpenStax Chemistry 2e). Intermolecular attractions generally increase with molecular weight (LibreTexts, Real Gases/02%3A_Properties_of_Gases/2.04%3A_Real_Gases)).
Carbon dioxide shows this strongly. In the same LibreTexts chapter, its van der Waals attraction constant a is 3.59 L² atm mol⁻², against 0.244 for hydrogen, roughly 15 times larger.
What does Z greater than 1 mean?
Z > 1 means size and repulsion are winning: at high pressure the volume of the molecules themselves becomes a noticeable part of the total volume, so the gas is harder to squeeze than an ideal gas (OpenStax Chemistry 2e). LibreTexts puts it as the stronger repulsive forces bending the curve upward once molecules crowd into each other's space (LibreTexts, Real Gases/02%3A_Properties_of_Gases/2.04%3A_Real_Gases)).
Every gas ends up above 1 if you push the pressure high enough. What differs between gases is whether there is a dip first.
Why does H₂ have Z > 1 while CO₂ dips below 1?
We took measured molar volumes for both gases at 320 K from the NIST Chemistry WebBook fluid data and computed Z = PV/RT ourselves; the graph at the top plots them.
Hydrogen: Z is 1.0006 at 1 bar, 1.06 at 101 bar, 1.30 at 501 bar and 1.60 at 1001 bar. In every value we checked it only climbs.
Carbon dioxide: Z falls from 0.996 at 1 bar to a minimum of about 0.31 near 120 bar, crosses back through 1 at about 610 bar and reaches 1.52 at 1001 bar.
Temperature is the hidden variable. Higher temperatures let thermal motion overcome attractions, and each gas has a Boyle temperature at which attractions and repulsions exactly balance at zero pressure (LibreTexts, Real Gases/02%3A_Properties_of_Gases/2.04%3A_Real_Gases)). A curve that rises from the very start, like hydrogen's here, tells you the gas is above its Boyle temperature: its weak attractions never get the upper hand.
How far is CO₂ from ideal at 100 bar? A worked example
NIST gives the molar volume of CO₂ at 320 K and 100 bar as 0.0982 L/mol (NIST Chemistry WebBook).
The ideal molar volume is RT/P = (0.08314 × 320)/100 = 0.266 L/mol.
Z = 0.0982/0.266 = 0.37.
Interpret it: the real gas fills only about 37% of the room the ideal law predicts. In an exam you would write: Z < 1, attractive forces dominate, the gas is more compressible than an ideal gas.
Now try hydrogen at 501 bar and 320 K. NIST gives 0.0690 L/mol. You should get Z of about 1.30, so hydrogen fills about 30% more room than ideal.
For the equation behind these curves, read real gases and the van der Waals equation, with worked numbers, then Thomas Andrews and the critical temperature of carbon dioxide and why CO₂ breaks the rules of the compressibility factor.
How do you read a Z vs P graph in an exam?
A four-step check for any graph:
Find the line Z = 1. Above it means harder to compress than ideal; below it means easier.
Look at how each curve starts. A curve that goes down first belongs to a gas whose attractions matter at that temperature (CO₂ here). A curve that rises straight away belongs to a gas whose attractions are already outrun (H₂ here).
Look at the far right. At high enough pressure every curve climbs above 1, because molecules have size.
Check the temperature. The same gas behaves more ideally when hotter, so compare curves only at one temperature.
If real-gas graph questions still trip you up, the Fermi Problem Library has worked problems with a step-by-step solver that explains the reasoning rather than printing an answer. For the idea itself, the Fermi Concept Library gives every chemistry concept its own lesson and its place in the map.