

On this page
When you use the ideal gas law (PV = nRT), you assume gas molecules take up zero space and never pull on each other. Real gases like carbon dioxide (CO₂) ignore both rules. The compressibility factor, Z = PV / nRT, measures exactly how much a real gas breaks the ideal assumption. For an ideal gas, Z is exactly 1. For a real gas, it swings up and down depending on the pressure and temperature.
Why does Z drop below 1 at moderate pressure?
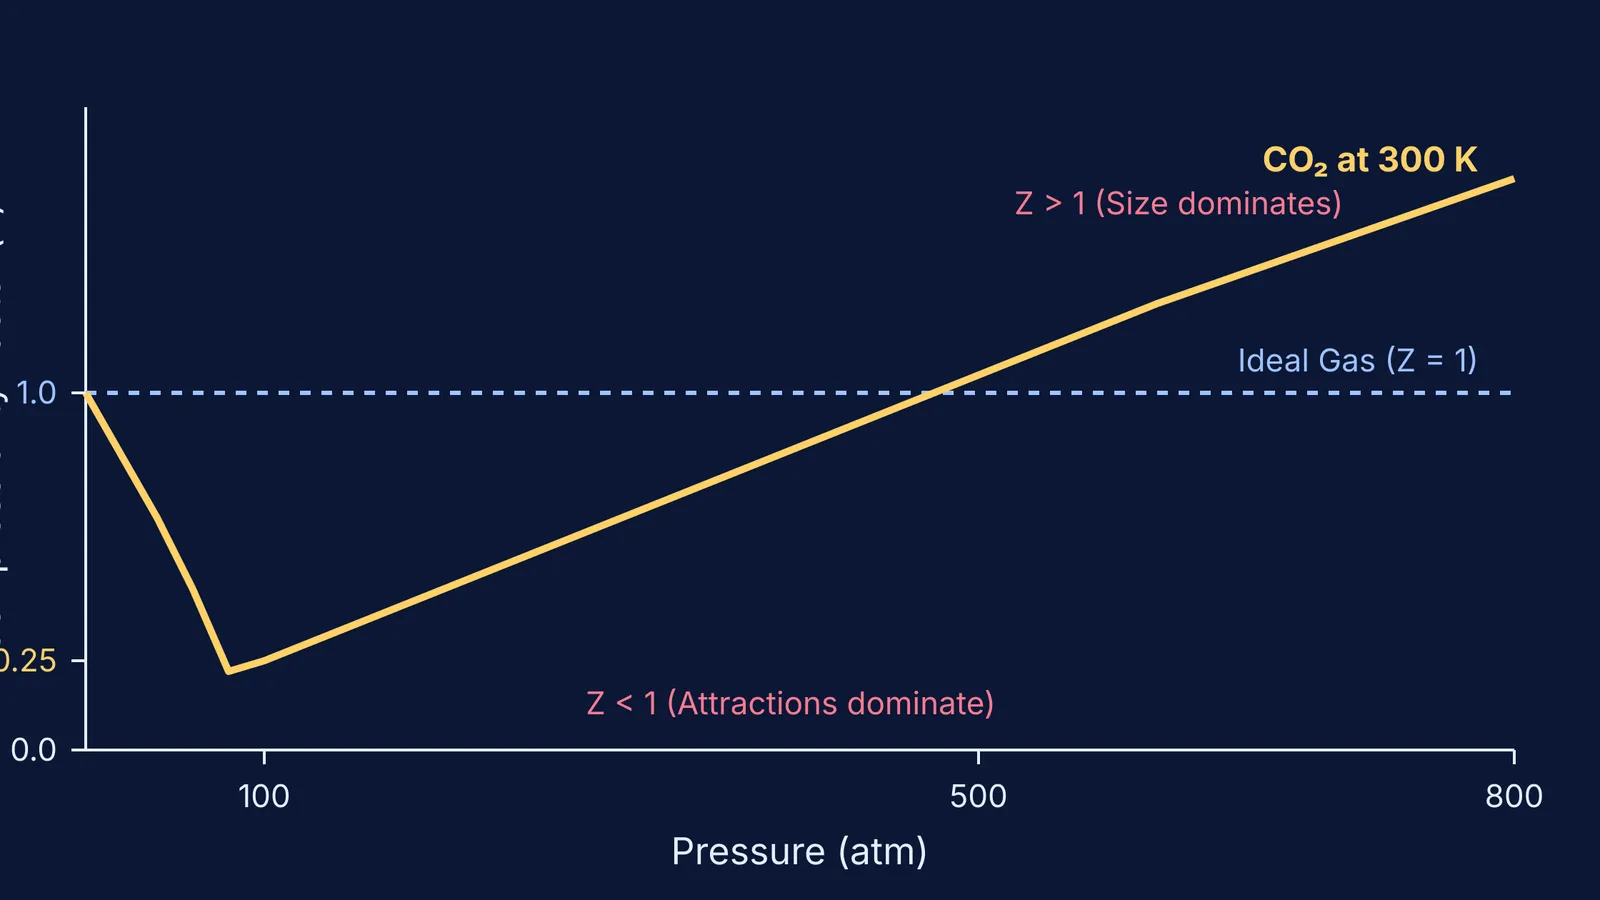
At normal room temperature (like 300 K) and moderate pressures, molecules are pushed close enough together that their attractive forces—specifically, van der Waals forces—start to matter. According to standard models covered by the Wikipedia overview of the compressibility factor, when Z < 1, these attractive forces dominate. They pull the gas molecules closer together than the ideal gas law predicts, making the real volume smaller.
For CO₂, this effect is dramatic. Because its molecules have relatively strong attractions compared to nitrogen or hydrogen, its Z value plunges as pressure rises. Data from the NIST Chemistry WebBook shows that at 300 K and 100 atm, the compressibility factor of CO₂ hits approximately 0.23. The gas compresses so easily that it condenses into a high-pressure liquid.
When does Z go above 1 for carbon dioxide?
If you keep squeezing the gas, the story flips. At extremely high pressures, the molecules are packed so tightly that their physical volume—the space the actual atoms take up—becomes the main factor.
When Z > 1, repulsive forces dominate. The Wikipedia overview of the compressibility factor highlights that molecules physically cannot be squished any closer without overlapping, so they push back. At this point, the gas is less compressible than an ideal gas. For CO₂ at 300 K, this turnaround begins after its initial dip. By the time the pressure crosses 500 atm, the sheer crowding of the molecules forces Z to climb past 1 and keep rising. This competition between attraction and physical size is the core of real gases and the van der Waals equation.
What happens at the critical temperature?
The behaviour of Z depends heavily on the temperature of the gas. According to the NIST Chemistry WebBook, carbon dioxide has a critical temperature of 304.1 K (about 31.1 °C). Below this temperature, compressing the gas will eventually force it to turn into a liquid. When a phase change occurs, the compressibility factor Z effectively breaks down as a useful single metric because the substance is no longer a gas.
However, just above the critical temperature, CO₂ becomes a supercritical fluid. In this state, it can be compressed to densities matching those of liquids without ever forming a distinct liquid phase. Because 300 K is incredibly close to this critical point, the attractive forces at 100 atm are at their absolute peak efficiency, dragging Z down to 0.23. If you were to heat the gas to 400 K, the molecules would zip past each other too fast for the attractions to take hold as strongly. At that higher temperature and the same 100 atm, Z would sit closer to 0.82, as noted in the NIST Chemistry WebBook—still non-ideal, but much closer to 1. This illustrates a general rule: as temperature rises, a real gas behaves more like an ideal one.
A framework for calculating the deviation
When facing exam questions or engineering problems regarding gas compression, you can predict the behaviour of any gas using the principle of corresponding states. This framework compares a gas to its critical point using reduced variables:
Find the reduced pressure by dividing the actual pressure by the critical pressure (Pr = P / Pc). Data from the NIST Chemistry WebBook defines Pc for CO₂ as approximately 72.8 atm.
Find the reduced temperature by dividing the actual temperature in Kelvin by the critical temperature (Tr = T / Tc).
Plot these values on a generalized compressibility chart.
This method works because most gases behave similarly when they are the same relative distance away from their critical points. By calculating Pr and Tr, you can estimate Z without needing complex, gas-specific tables for every substance. For our CO₂ example at 100 atm and 300 K, the reduced pressure is roughly 1.37 and the reduced temperature is about 0.99. Looking at any standard compressibility chart at these coordinates confirms a steep drop in Z, aligning perfectly with the dominance of attractive forces.
How can you test this with a simulation?
Reading about intermolecular forces is one thing, but picturing them balancing out in real time is another. If you find yourself guessing which force wins at a given pressure, the Fermi Concept Library maps out every gas law to help you build the intuition.
Instead of just memorising graphs, you can adjust the temperature and pressure in the Fermi Simulation Lab and watch the molecules pull together or bounce apart. You can set the pressure to 100 atm to see attractions dominate, then crank it to 600 atm to watch molecular size force the particles to repel.
To get the full picture, you must also consider temperature. Heating the gas gives molecules more kinetic energy, making it harder for weak attractions to pull them together, pushing the gas closer to ideal behaviour as explored in ideal gas problems.


