
On this page
World Climate and Climate Change is Chapter 11 of the NCERT book Fundamentals of Physical Geography. It sorts the world's climates with Koeppen's letter code, explains greenhouse gases, and asks how we know climate changes.
Is World Climate and Climate Change in the Class 11 exam?
Not in the written paper. The CBSE Geography curriculum for 2026-27 lists Chapter 11 under Unit IV (Climate) with the note "to be tested through internal assessments in the form of project and presentation". The chapter is still in the NCERT textbook, reprint 2026-27. It sends you to India: Physical Environment for the detail on India's monsoon (Am) climate, and that book's Climate chapter is in the written paper.
How does Koeppen's classification of climate work?
Koeppen's scheme is an empirical classification: it is built from observed mean monthly temperature and precipitation, not from the causes of climate (NCERT, Chapter 11). Koeppen linked climate to vegetation and developed the scheme in 1918.
The capital letter is the group:
A, Tropical: coldest month averages 18°C or more.
B, Dry: potential evaporation is greater than precipitation.
C, Warm temperate: coldest month between −3°C and 18°C.
D, Cold snow forest: coldest month −3°C or below.
E, Cold: every month averages below 10°C.
A, C, D and E are humid climates and B is dry. Small letters then add the season of dryness: f for no dry season, m for monsoon, w for a dry winter and s for a dry summer. In dry climates, S means steppe and W means desert, and a final h or k marks low-latitude or mid-latitude.
Worked example: read the code
Take Cwa, which NCERT gives for the North Indian plains. C: the coldest month is mild, above −3°C. w: winter is the dry season. a: hot summer. Now try BWh: B, dry; W, desert; h, low latitude (15°-35°). And Am, the type NCERT gives for the Indian subcontinent: tropical, with a short dry season and heavy summer rain. For the story of how Wladimir Köppen built the letters, read our post on how climate zones get their letters.
What are greenhouse gases and why do they warm the Earth?
The atmosphere lets in short-wave sunlight but absorbs most of the long-wave radiation the Earth's surface sends back up; the gases that absorb it are called greenhouse gases (NCERT, Chapter 11). The chapter names carbon dioxide, CFCs, methane, nitrous oxide and ozone. For the same idea at work in Indian farms, see how a polyhouse traps heat.
In 2019, atmospheric CO2 stood at 410 parts per million, higher than at any time in at least 2 million years (IPCC AR6 Synthesis Report, Summary for Policymakers). Methane (1,866 parts per billion) and nitrous oxide (332 parts per billion) were higher than at any time in at least 800,000 years.
If the difference between short-wave and long-wave radiation is the part that will not stick, the Fermi Concept Library gives each concept its own lesson and shows where it sits in the map, so you can revisit radiation and heat balance first.
What is the evidence that climate is changing?
NCERT lists the natural archives: advances and retreats of glaciers, sediments in glacial lakes, tree rings that record wet and dry years, and historical records of crops, floods and migration (NCERT, Chapter 11). Its causes: sunspots, Milankovitch cycles, volcanoes and, most important among human effects, greenhouse gases.
The textbook's figures stop in 2000. Use newer ones:
Global surface temperature was 1.09°C higher in 2011-2020 than in 1850-1900, and the IPCC says human activities have unequivocally caused this warming (IPCC AR6 SYR).
The World Meteorological Organization found 2024 the warmest year on record, about 1.55°C (±0.13°C) above the 1850-1900 average (WMO).
The same WMO release says 2015-2024 were the ten warmest years on record, and that long-term warming is currently estimated at about 1.3°C. The Paris goal is measured over decades, so one year above 1.5°C does not mean it has been missed.
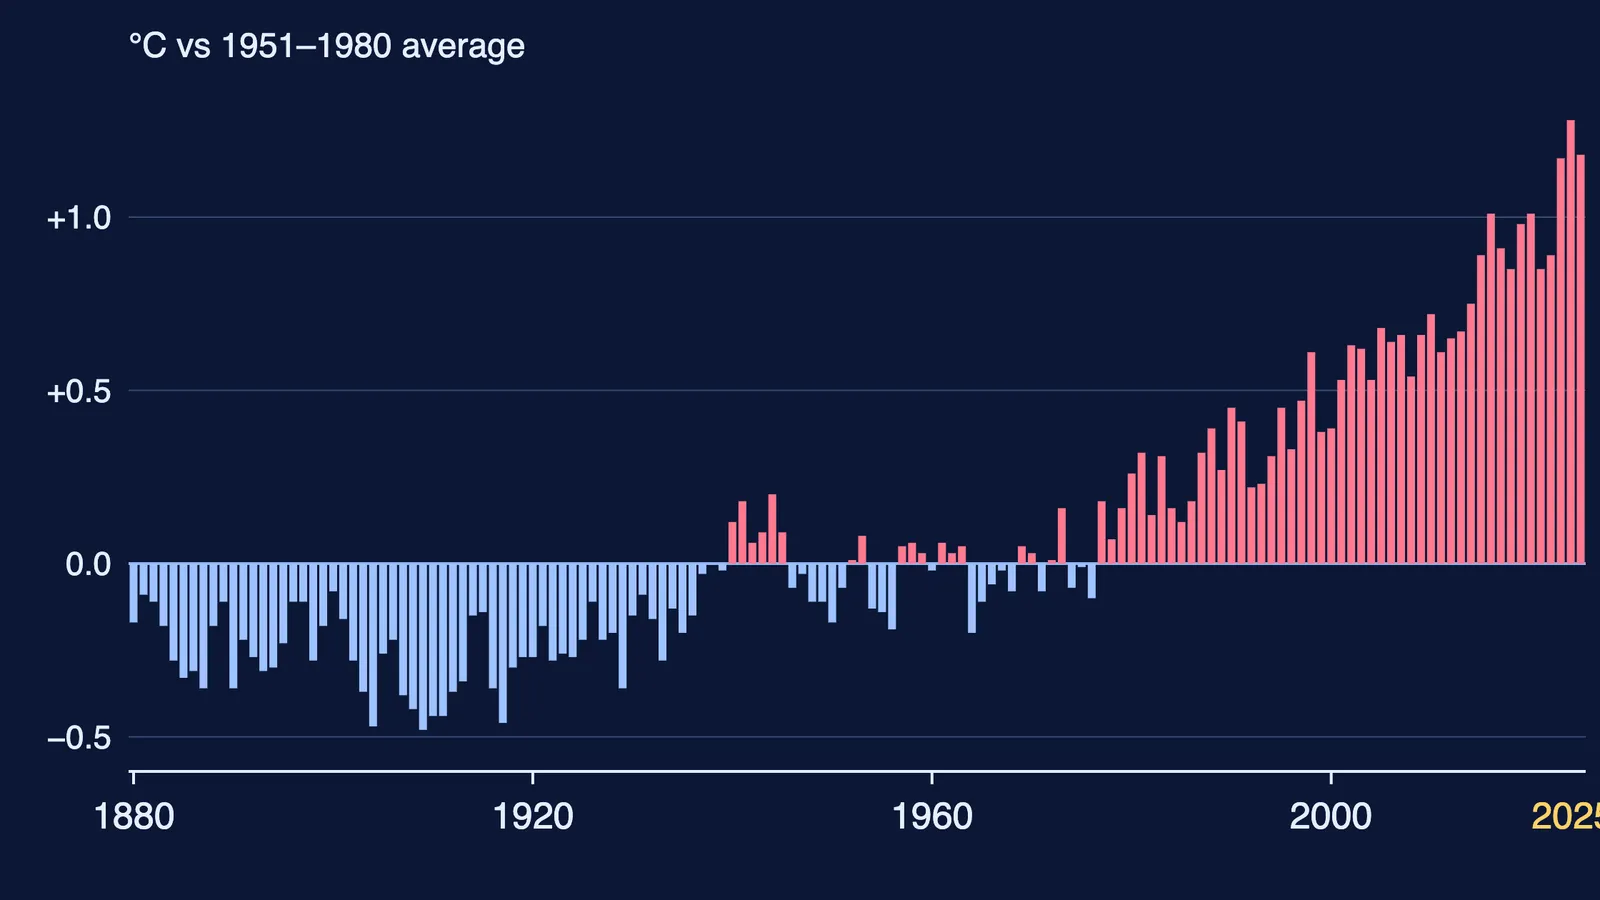
The chart at the top of this page plots NASA's GISTEMP annual global means from 1880 to 2025. It compares with 1951-1980, not 1850-1900, so its numbers are smaller than the IPCC's. Say which baseline you use.
How should you plan the project and presentation?
A three-week plan:
Week 1, pick one question. For example: which Koeppen types does India have, and how might warming change them? Or NCERT's own task: the Kyoto Protocol (1997, in force 2005).
Week 1, collect data from official bodies only. IPCC, WMO, the India Meteorological Department, NCERT.
Week 2, make one chart yourself. A Koeppen map of India coloured by type, or a temperature graph from GISTEMP. Label the axes and the source.
Week 2, write a five-slide talk. Question, evidence, your chart, what it means for India, sources.
Week 3, rehearse out loud twice and prepare for "What baseline is that against?"
When an idea is easier to see than to read, the Fermi Simulation Lab has interactive simulations to explore it. Curious about a career? Read how to become a climate scientist in India.